



Weikrui Optoelectronics · Process Testing Center | August 2026
PA12 GF30 (30% chopped glass fiber reinforced polyamide 12) is widely used in new energy valve bodies, piping systems, and fluid-handling components due to its excellent chemical resistance, low water absorption rate, and dimensional stability. However, in laser-transmission welding of circumferential interference fits, a hidden defect poses a threat to the long-term reliability of the product: the glass fiber enrichment layer within the weld seam.
We recently tested five PA12 GF30 products and identified a common pattern: the welding process window for PA12 is extremely narrow when evaluated using OCT testing; even minor carelessness can lead to glass fiber enrichment or poor soldering. Once an enrichment layer forms, passing short-term air-tightness tests does not guarantee long-term reliability, particularly in environments with extreme temperature fluctuations.
I. Glass Fiber Enrichment: The "Hidden Killer" in Weld seams
The essence of welding lies in the interpenetrating entanglement of molecular chains.
Laser welding is not a simple "melting–solidification" process. When the interface temperature exceeds the melting point of PA12 (176–180 °C), the resin molecular chain segments on both sides acquire thermal mobility, enabling them to cross the original joint interface, interpenetrate, and intertwine, thereby forming a molecular-scale entanglement network. The higher the density of entanglement points, the stronger the weld; insufficient entanglement results in a poor weld.
Fiberglass does not participate in welding, yet it "occupies" the welding space.
E-glass fiber has a softening temperature of approximately 840 °C; within the PA12 welding temperature range (approximately 180–240 °C), it remains completely in the solid state and does not participate in any molecular chain entanglement. A 30% glass fiber content implies that the weld zone contains a large number of "non-welding" rigid particles. While such particles can be controlled when dispersed uniformly, once a continuous enrichment of these particles forms at the joint interface, the consequences become entirely different.
How does the enrichment layer form?
In circumferential interference structures, the clamping force remains constant throughout the entire process and is not adjustable. Once the interface enters the molten zone, the low-viscosity PA12 melt flows outward from the gaps between the glass fiber network under continuous extrusion; the rigid glass fibers are retained and accumulate at the original joint interface, forming a enriched thin layer with a glass fiber volume fraction significantly higher than that of the base material. Higher temperatures result in lower melt viscosity, faster resin overflow, and a thicker enriched layer.
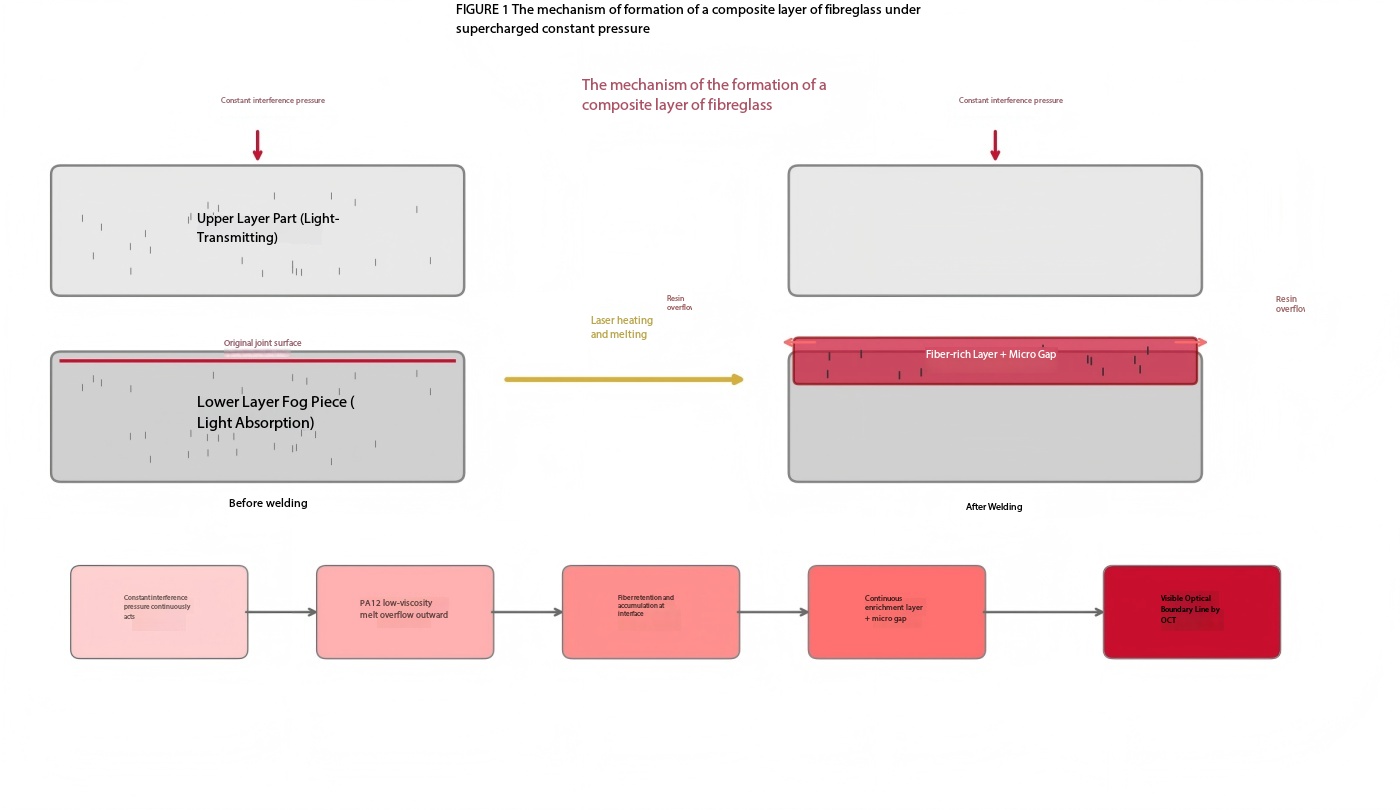
Figure 1: Formation mechanism of the glass fiber-enriched layer under interference fit constraints
Triple damage mechanism
▎ ① Physical blocking – the continuous enrichment layer occupies the interface space, preventing the resin molecular chains from crossing the interface, thereby significantly reducing the effective bonding area.
▎② Weak interface effect — The bonding between the glass fiber surface and the resin relies solely on nanoscale coupling agents, resulting in a much weaker resin–resin entanglement compared to other methods, thereby actively introducing numerous weak interfaces.
③ Micro-gap leakage channel — After the resin is extruded, gaps are left behind; the refractive index of air ≈ 1.0, creating a refractive index discontinuity with the PA12 matrix, which constitutes the direct source of the OCT high-contrast signal.
Fiber enrichment is not merely a minor process defect, but rather an inherent structural flaw formed within the weld seam; it weakens the bonding strength at the molecular level and introduces potential risks of fatigue and thermal shock failure at the microscale.
II. Temperature-induced leakage: temperature sensitivity in enrichment zones
Air tightness qualification = Welding qualification
We encountered a real-world case: a PA12 product passed the air tightness test after welding, but exhibited through-type leakage channels following the high-and low-temperature impact test. OCT scanning revealed continuous residual interface defects in the weld seam—where micro-gaps within the enrichment layer were widened and breached under thermal stress, ultimately leading to leakage.
Why are the enrichment layers so sensitive to temperature changes?
Thermal expansion mismatch is the root cause. The linear thermal expansion coefficient of pure PA12 resin is approximately 80–120 × 10⁻⁶/K, whereas that of E-glass fiber in the axial direction is approximately 5.0–5.4 × 10⁻⁶/K, resulting in a discrepancy of 15–24 times. During abrupt temperature changes, there is a severe mismatch in expansion and contraction between the glass fibers and the resin within the reinforcement layer, generating significant thermal stress that directly tears the already fragile interfacial bond. (Note: For GF30 composite materials, the overall CLTE is reduced to approximately 30–50 × 10⁻⁶/K due to the constraint effect of the glass fibers; however, because the local resin content within the reinforcement layer is high, its thermal expansion coefficient approaches that of pure resin.)
PA12 viscothermal properties: the melt flow behavior undergoes a drastic change for every 20 °C increase in temperature.
The melt viscosity of PA12 is highly sensitive to temperature—ranging from its melting point (approximately 176–180 °C) to 230–240 °C, where the apparent viscosity can decrease by several orders of magnitude; particularly within the range from the melting point to 200 °C, the viscosity decreases dramatically. This implies that even minor deviations within the welding temperature window can lead to a qualitative change in the resin's flow behavior: at lower temperatures, the viscosity becomes excessively high, making it difficult for the resin to extrude from the glass fiber network, while molecular segment diffusion is severely restricted, thereby increasing the risk of poor soldering; conversely, at higher temperatures, the viscosity drops sharply, causing the resin to migrate rapidly, exacerbating the accumulation of glass fibers, and leading to rapid thickening of the resin-rich layer. This "one-size-fits-all" nature of the viscosity–temperature response makes the usable process temperature range for PA12 significantly narrower than that of conventional engineering plastics.
Crystalline shrinkage-induced magnified interface stress
PA12 is a semi-crystalline polymer with a typical crystallinity ranging from 40% to 50%. During the welding heat cycle, the interface resin undergoes a "melting–cooling recrystallization" process. During recrystallization, the resin experiences volume contraction; however, the contraction of the resin confined within the enrichment layer—due to the constraint imposed by the glass fiber network—is impeded, generating radial contraction stress at the glass fiber–resin interface. This stress superimposes with the thermal expansion mismatch stress, thereby further widening the micro-gap during the cooling phase. When subsequent temperature impact tests apply another heat cycle, each iteration of the "expansion–contraction–recrystallization" sequence continues to expand the existing micro-gap, ultimately leading to through-wall leakage.
Comparison with PA66: Why is PA12 more brittle?
As both are polyamides, PA66 exhibits significantly weaker enrichment tendency during high glass fiber welding. There are three key differences: ① The amide group density between molecular chains in PA66 is higher (with approximately twice as many amide groups per carbon atom compared to PA12), its hydrogen bond density is greater, its melt strength is higher, and the resin is less prone to extrusion; ② The melt viscosity of PA66 shows lower temperature sensitivity than that of PA12, resulting in relatively smooth viscosity variations within the welding temperature window and a weaker overflow driving force for the resin; ③ PA66 crystallizes faster and has a shorter residence time in the molten state, meaning the resin solidifies before having time for large-scale migration. Consequently, under interference constant-pressure conditions, the driving force for "two-phase separation" in PA12 is far greater than that in PA66, making it more likely for the enrichment layer to develop into a continuous through-layer.
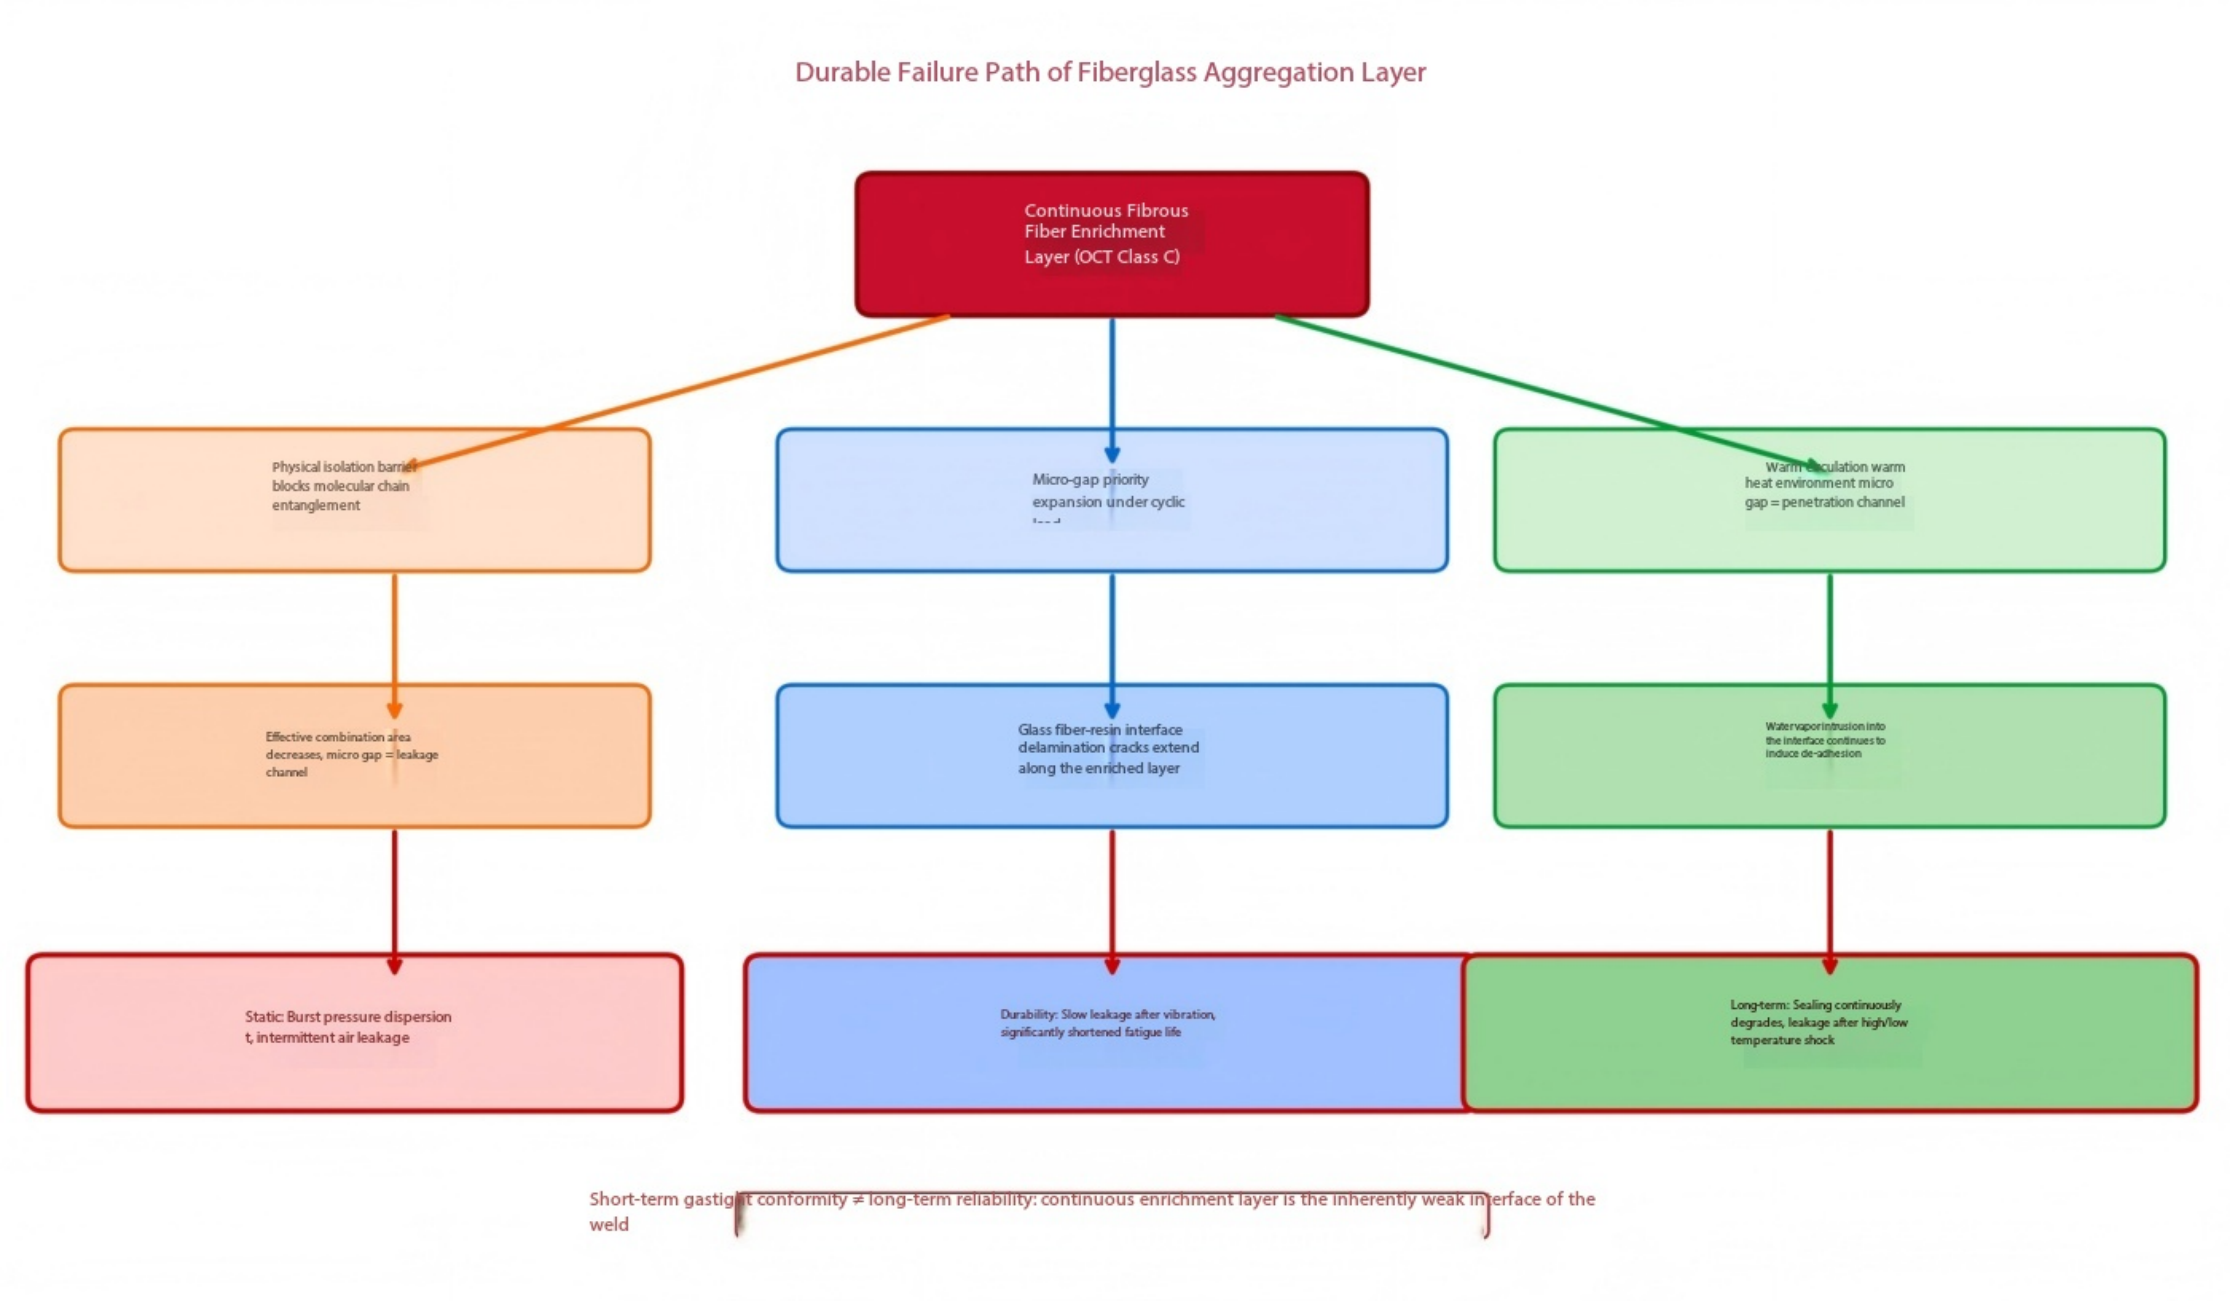
Figure 2: Glass fiber enrichment → durability failure path
DOE Experimental Study: Weld Joint Evolution under Environmental Stress
We conducted a four-stage DOE comparison on two specimens of the same product (Specimen No.1 at 180 °C and Specimen No.2 at 240 °C), sequentially undergoing: initial inspection → 2-hour boiling in water at 100 °C → cooling to room temperature → subsequent environmental stress exposure; at each stage, OCT was used to calculate the proportion of the welded area (effective weld fusion ratio):
Testing Phase | Part No.1 (180°C) | Part No.2 (240°C) | D-value |
original | 78.2% | 88.8% | +10.6% |
Boiled for 2 hours – hot state | 91.4% | 94.6% | +3.2% |
After boiling – let cool (allow to reach room temperature)) | 60.2% | 73.3% | +13.1% |
48-hour drying retest | 57.9% | 72.3% | +14.4% |
Key findings: The initial gap was only 10.6%; under environmental stress, it expanded to 14.4%. Component No.1 at 180 °C—near the melting point—experienced severely inadequate molecular diffusion, resulting in a sharp decline in the weld bonding rate by 31.2% during the post-welding cooling stage; this effectively exposed the cold solder joints under temperature cycling conditions. These results demonstrate that static sealing performance is far from sufficient, and OCT data obtained under environmental stress must be used to evaluate the true quality of the welds.
III. OCT Examination: Revealing Hidden Defects Without Concealment
What does OCT reveal?
Industrial OCT tomography utilizes differences in refractive indices across different media to generate scattering signals. When a weld seam forms a continuous glass fiber-rich layer, dense glass fiber–resin and resin–air interfaces collectively enhance scattering, resulting in continuous or discontinuous optical boundary lines on the tomographic image. OCT can not only qualitatively determine the weld seam classification but also quantitatively measure the effective weld fusion ratio under a unified ROI and calibration algorithm, enabling the capture of subtle evolution of the weld seam under environmental stress conditions.
Three-phase composite microstructure: The three sources of OCT signals
The OCT scattering at the weld interface is not attributable to a single factor, but rather results from a composite signal arising from the combined contributions of three distinct microstructures:
① Main phase – glass fiber enrichment zone: within the enrichment layer, the volume fraction of glass fibers rises sharply from 30% of the base material to values exceeding 50%; the refractive index of E-glass fibers is approximately 1.55–1.56, while that of the amorphous region of PA12 ranges from 1.51 to 1.52. Although the difference between these two values is small, the number of densely arranged glass-fiber–resin interfaces increases dramatically, resulting in a significant cumulative scattering cross-section effect that constitutes the primary source of the OCT signal.
② Secondary phase – micron/submicron-scale micropores. The air trapped within the voids left by resin extrusion (refractive index ≈ 1.0) forms a refractive index discontinuity of approximately 0.5 compared to the PA12 matrix (n ≈ 1.51–1.52)—representing the configuration with the strongest scattering among all interfaces. Even when the volume fraction of these micropores is only 1–3%, their contribution to the OCT signal significantly exceeds that of the enrichment zone itself. Whether these micropores are interconnected directly determines the gas-tightness and durability performance of the weld joint.
③ Weak signal – crystallinity, orientation, and diffusion gradient: The welding thermal cycle induces gradient variations in crystallinity, molecular chain orientation, and interfacial diffusion across both sides of the interface. The refractive index of the crystalline region is slightly higher than that of the amorphous region (Δn ≈ 0.003–0.008), forming a weak refractive index gradient layer. This signal is relatively weak and can only be detected by OCT systems with extremely high sensitivity; however, it effectively reflects whether the molecular chain entanglement is sufficient—i.e., whether the weld is "strongly bonded."
▎ The significance of the three-phase structure: OCT not only enables the "visualization" of glass fiber enrichment (primary phase) and microvoids (secondary phase), but also allows for the assessment of molecular diffusion quality (third phase) based on weak scattering signals. The comprehensive analysis of these three signal components constitutes the complete basis for weld zone grading and durability prediction.
Real-time OCT imaging comparison
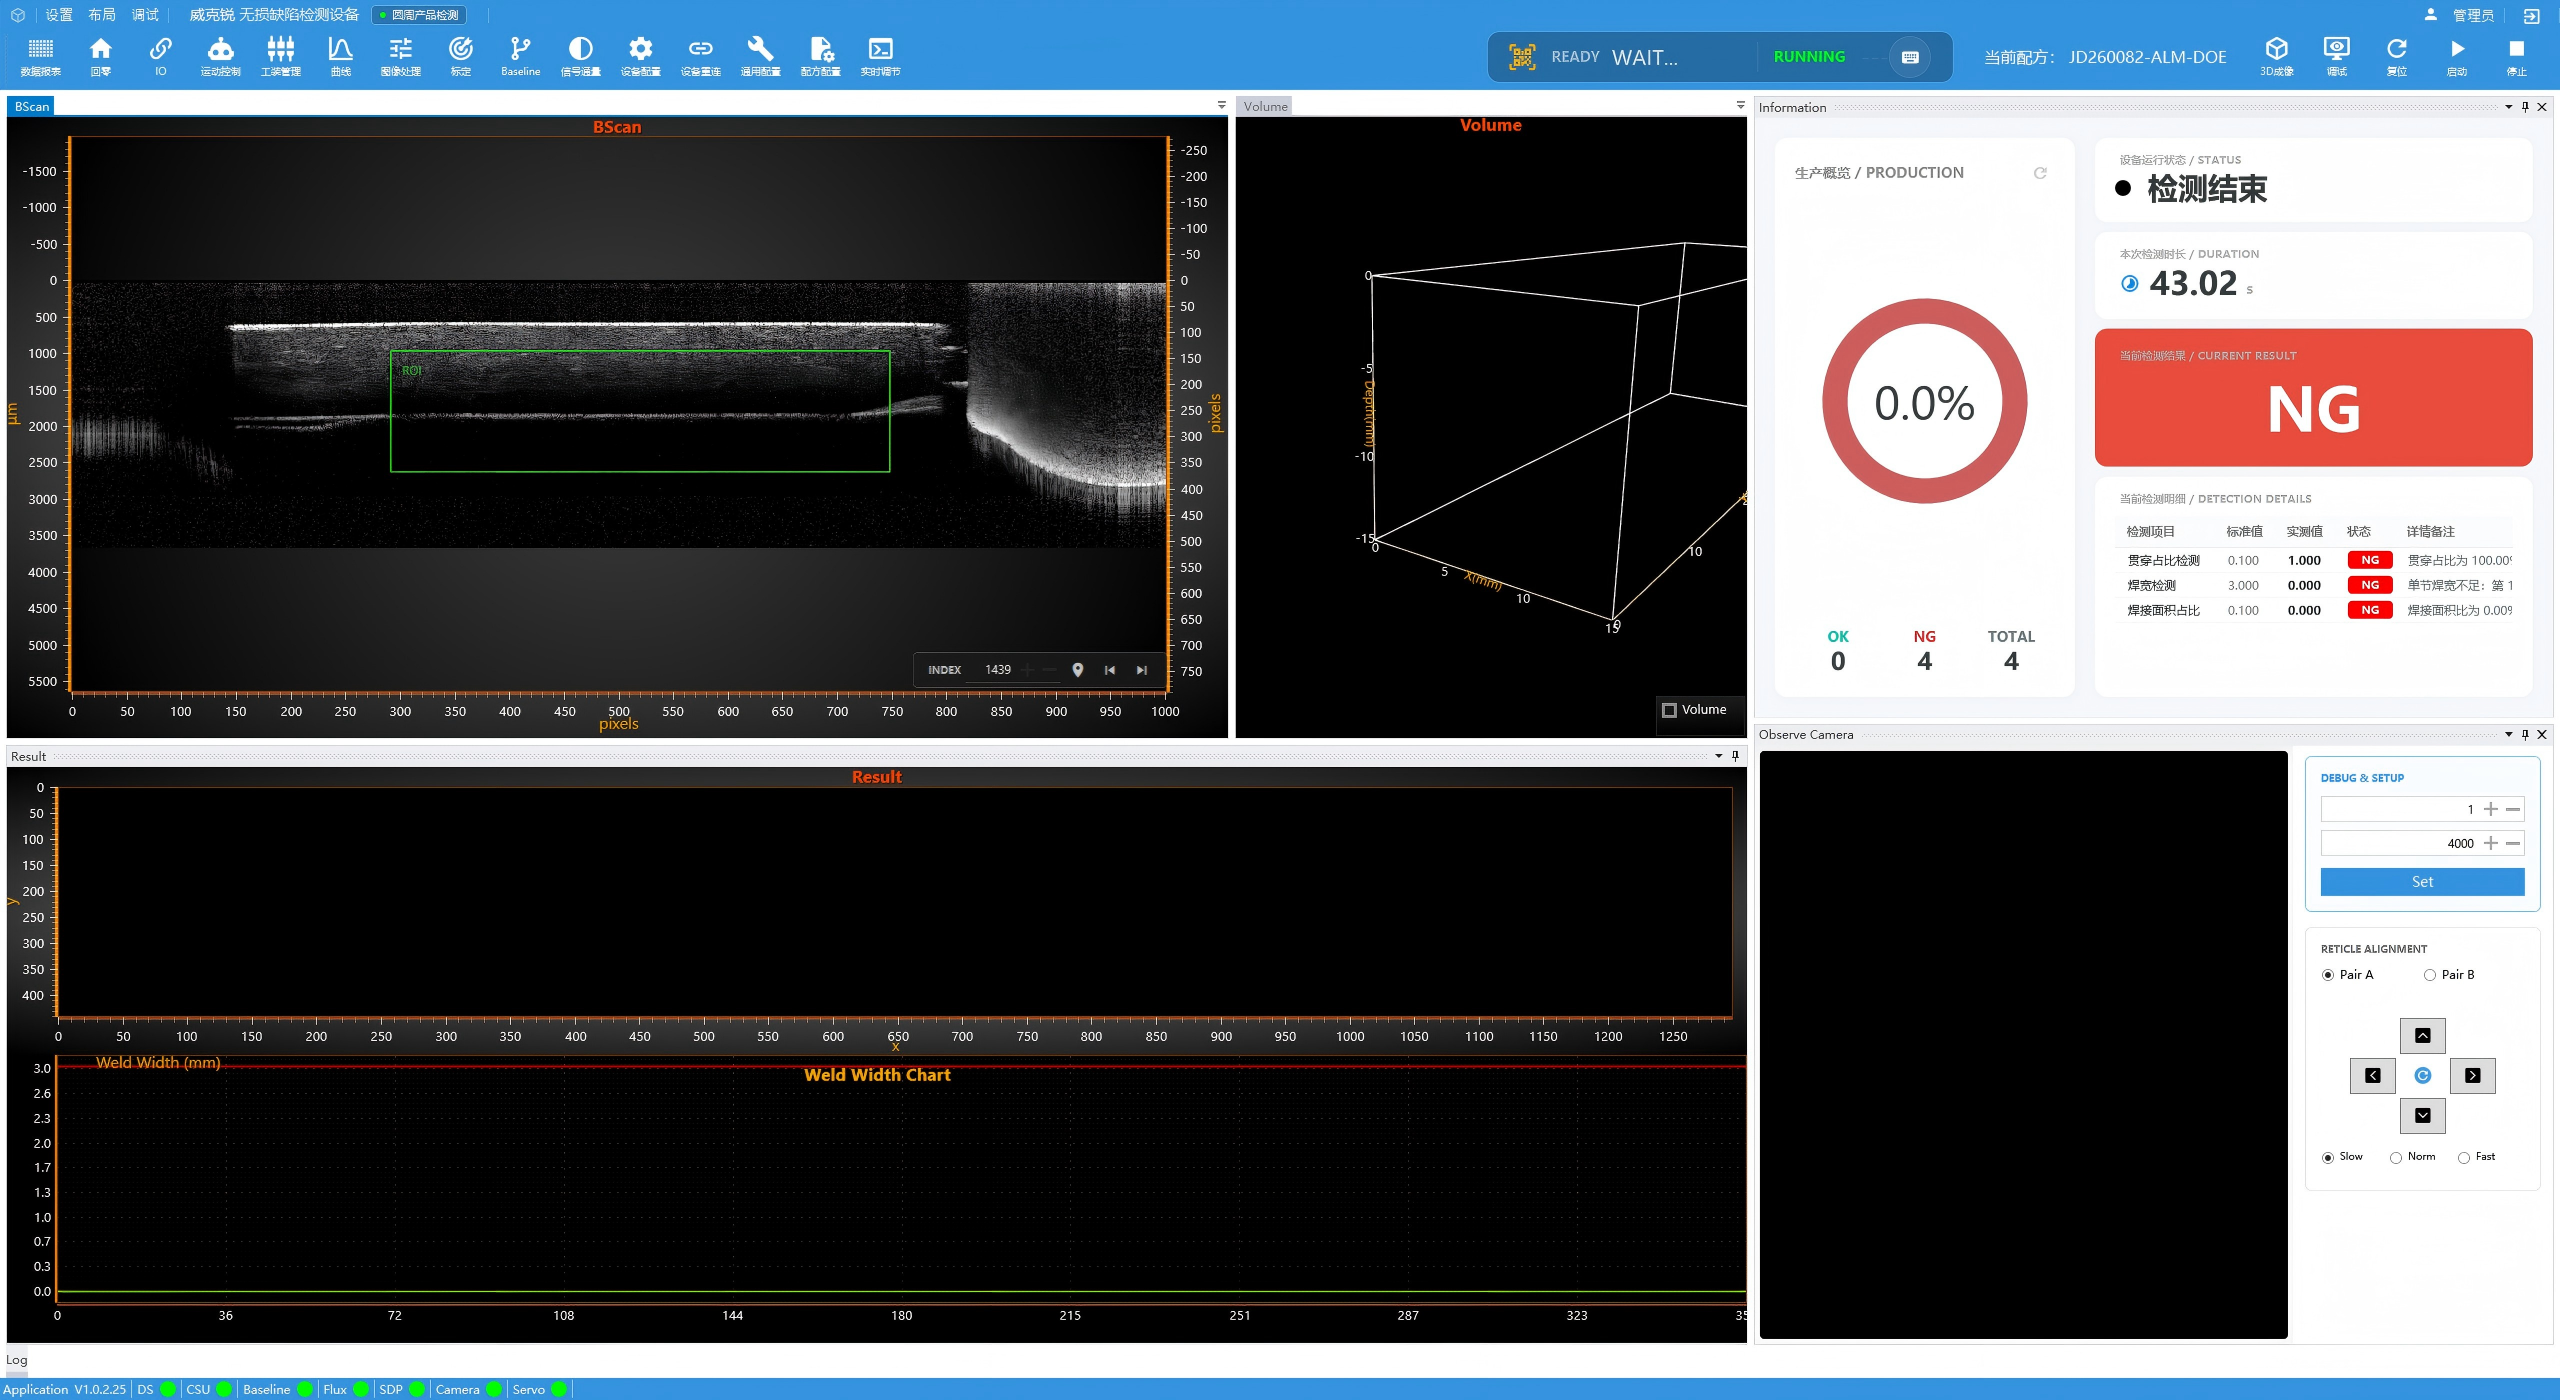
Figure A: Non-welded reference: The original joint surface exhibits a through-thickness high-reflectivity scattering band.
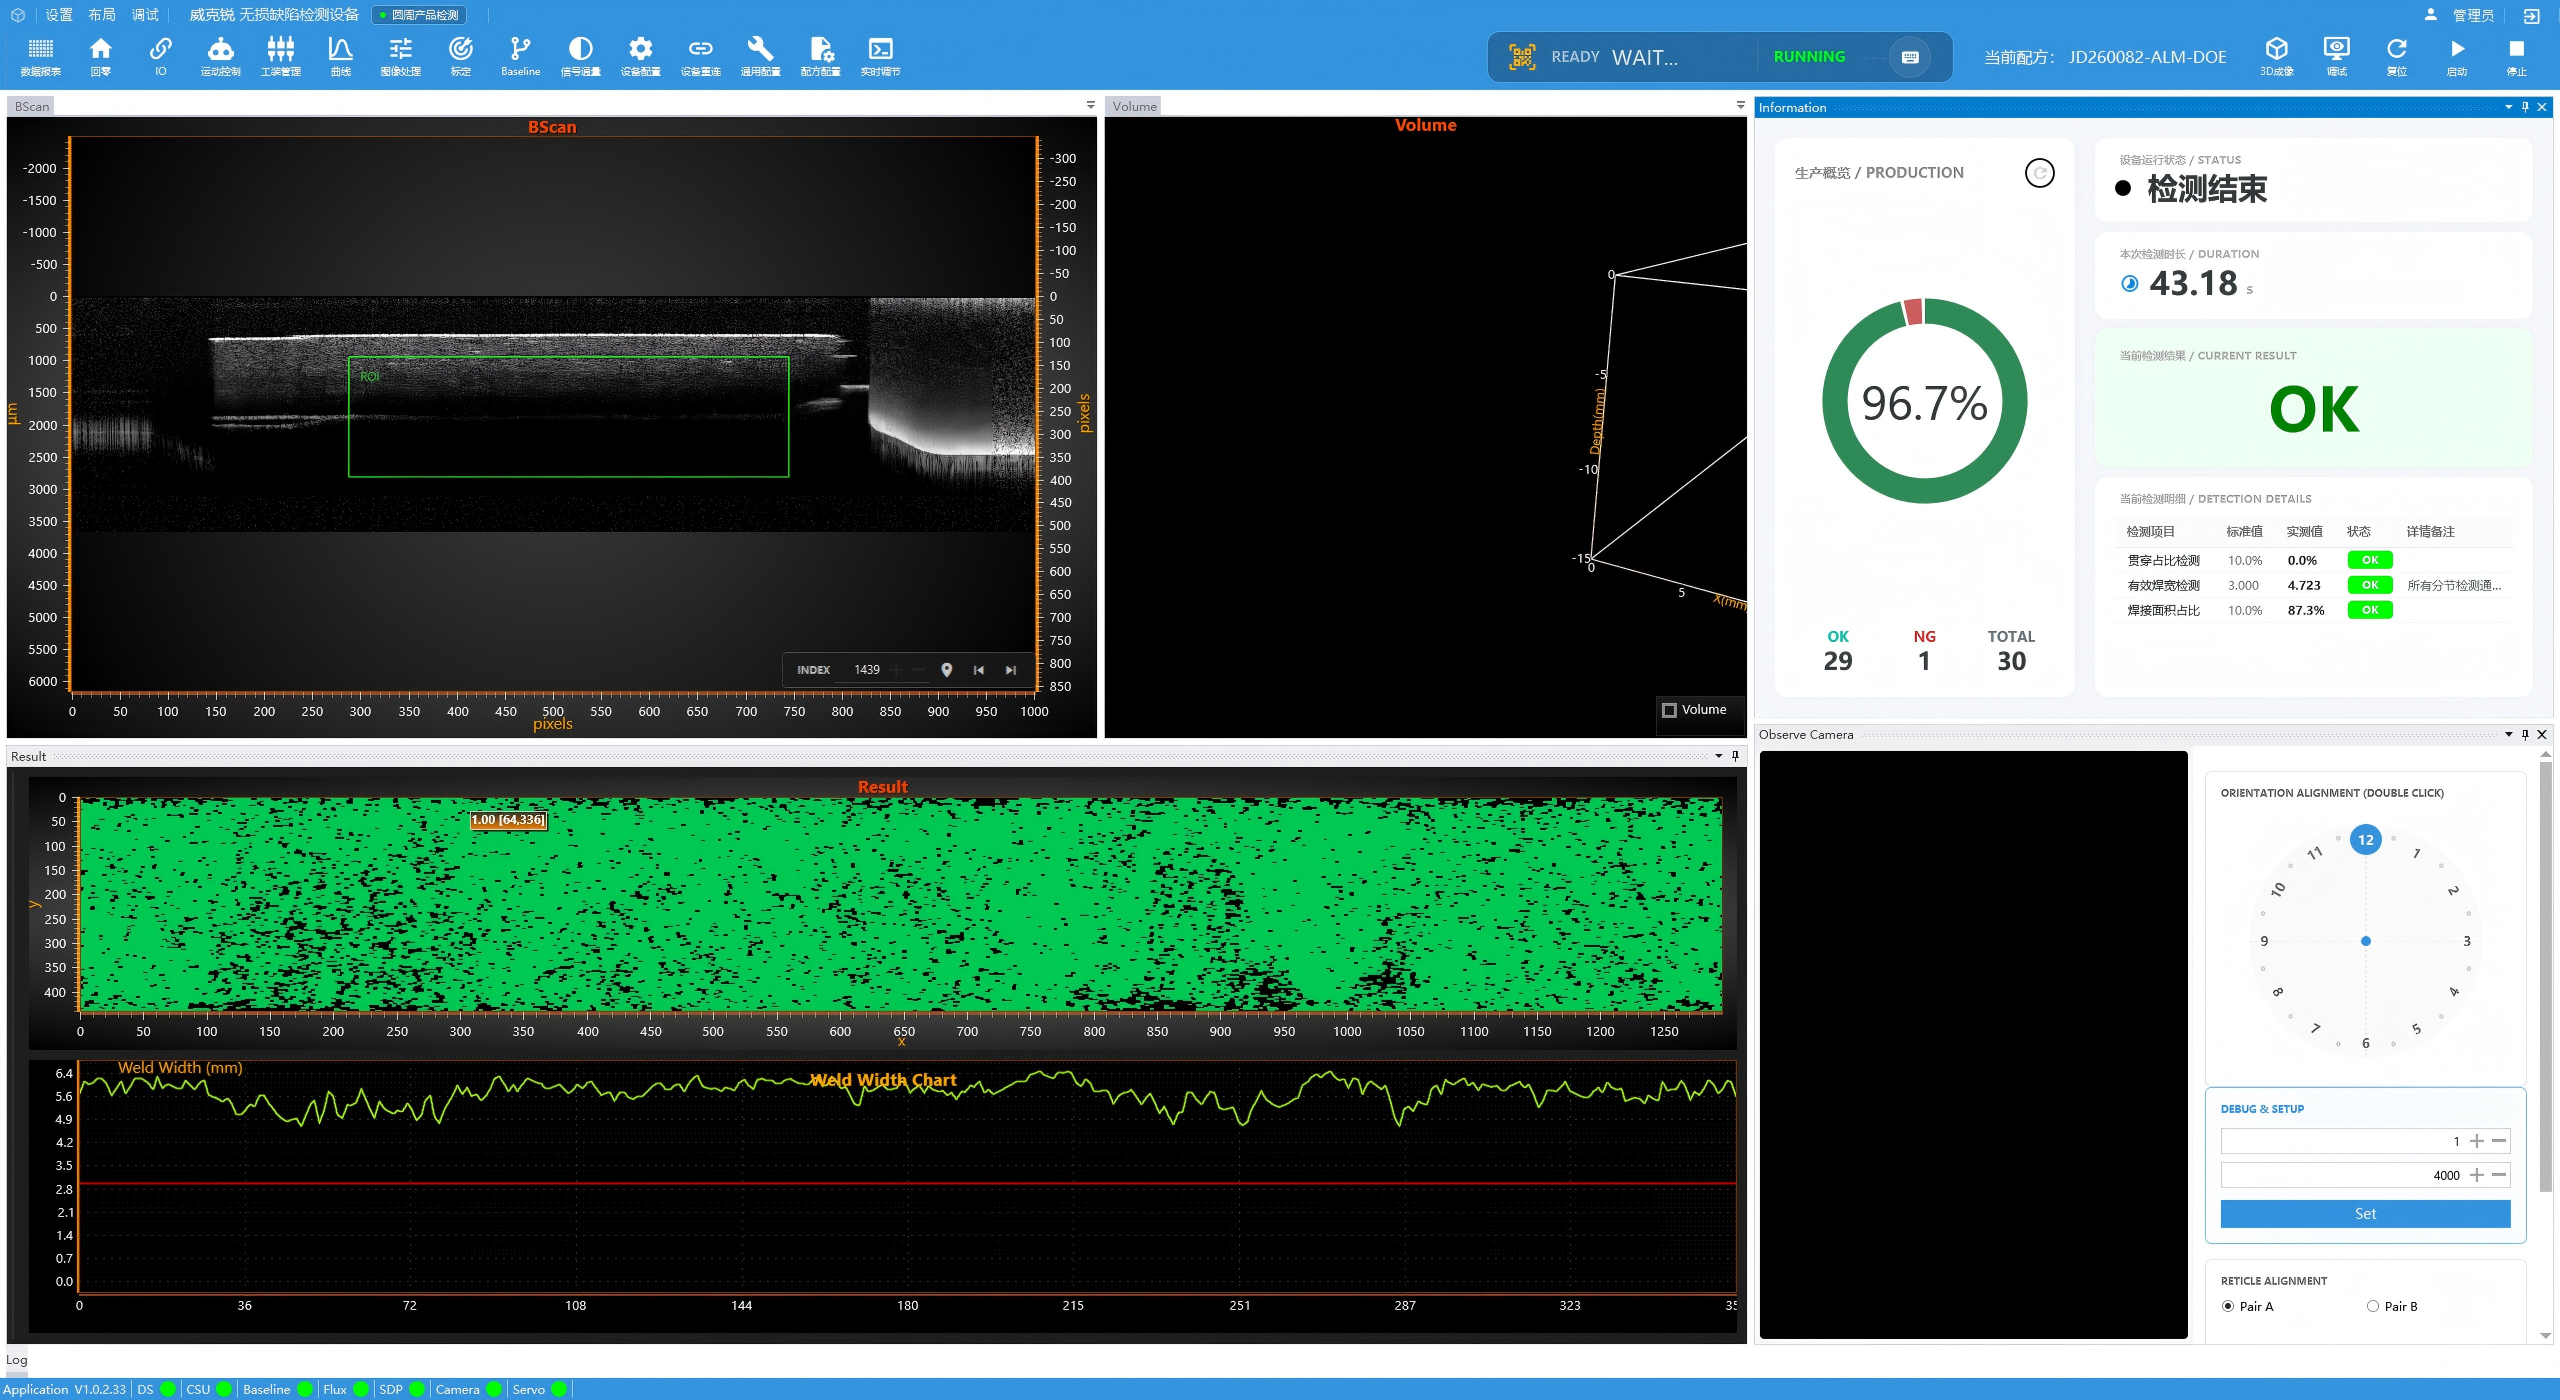
Figure b: Qualified welded parts (87.3%): The high-reflective strip is dispersed, with the green weld zone constituting the dominant portion.
Note: The absence of a weld on the high-contrast band indicates a "non-welded" condition (a narrow, bright continuous line); the brightness of the weld after welding is determined by the degree of glass fiber enrichment and the density of micro-gaps. These two mechanisms operate entirely differently; the OCT system utilizes this brightness difference to automatically calculate the proportion of the welded area.
S/A/B/C Level Welding Joint Classification Standards
Based on the OCT weld seam scattering characteristics, combined with the assessment of gas tightness and environmental stress performance, the following graded criteria are recommended:
grade | OCT Image Features | Engineering Assessment |
S-Class (Ideal case) | No continuous straight scattering boundary; only sporadic, weak scattering points. | Process Upper Limit Target |
Grade A (Mass-production qualified) | No through-going continuous bright lines; scattered fragmented discontinuities; effective weldability meets the specified requirements | Official clearance |
B-class ( critical ) | There are localized short continuous boundaries with a discontinuous distribution. | Must undergo aging validation before evaluation |
Class C (Non-compliant) | A continuous high-contrast boundary line spanning the entire circumference, or one accompanied by a through-type defect | Directly reject receipt |
▎ The core value of OCT testing: to perform non-destructive identification of hidden defects in the enrichment layer prior to product shipment from the factory, thereby preventing products that "pass the airtightness test but still contain enrichment" from entering the market and subsequently experiencing late-stage durability failure.
IV. "One Product, One Process": The narrow operating window characteristic of PA12
Cannot apply a single parameter indiscriminately.
Key insights from the testing of 5 products: The interference fit, weldable surface geometry, material batch, color/absorption system, and wall thickness vary across different products; therefore, optimal welding parameters cannot be directly applied. For each new product, a separate OCT-DOE database must be established to establish a corresponding relationship between "interface thermal history, effective weldability, scattering characteristics, and durability degradation."
Temperature Paradox: Assuming higher temperatures = better welding results
Product A exhibits a highly analytically significant contrast: when set at 160 °C (due to infrared temperature measurement deviations, the actual interface temperature is estimated to be approximately 190–200 °C), OCT imaging shows that the optical interface of the weld seam is virtually absent; however, when the same product is set at 200 °C, OCT imaging instead reveals more severe glass fiber enrichment.
Reason: When setting the temperature at 200°C, the peak interface temperature may exceed 220°C, leading to a significant decrease in melt viscosity and an intensified resin migration. Process evaluation must be based on the actual interface thermal history and OCT validation; it should not rely solely on the equipment set temperature.
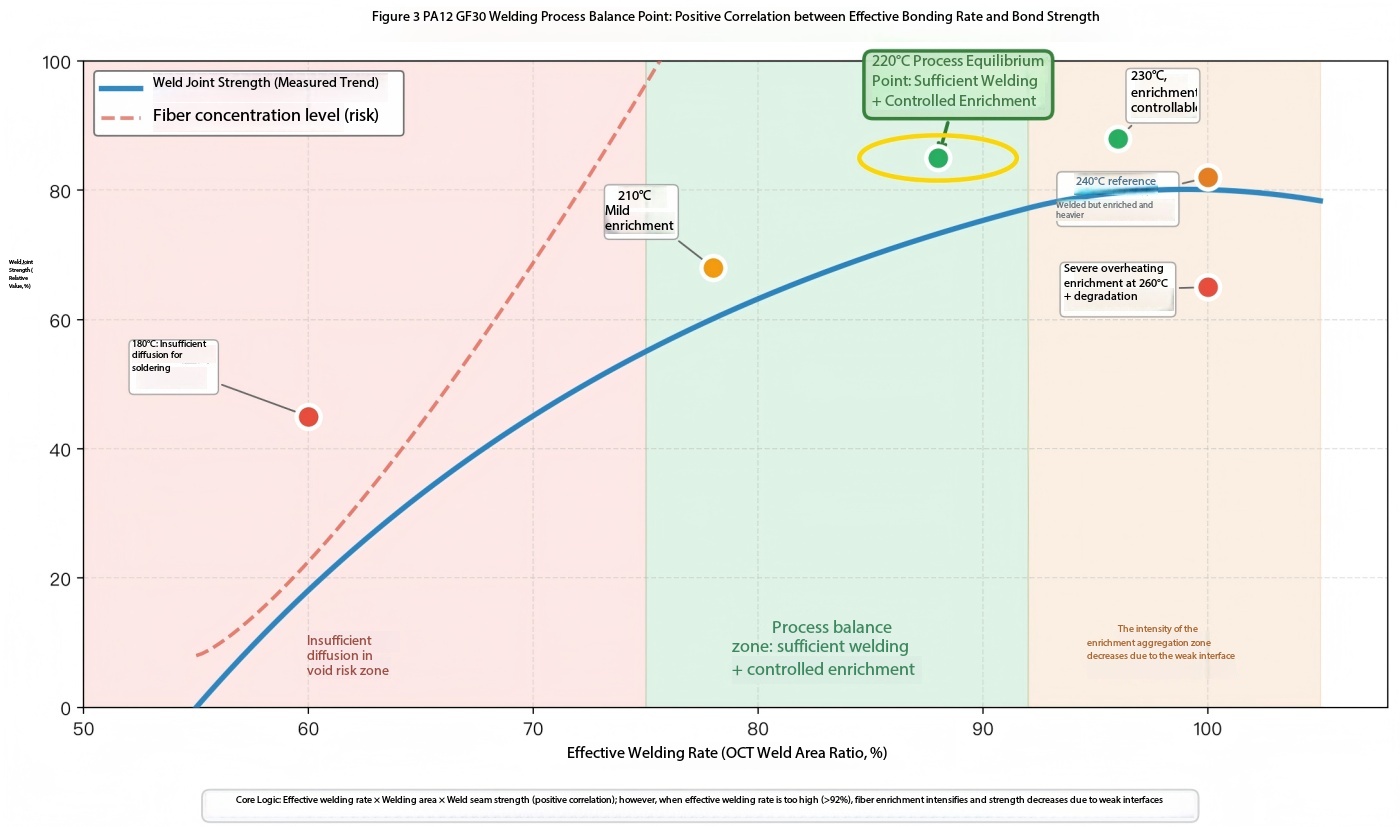
Figure 3: Welding process equilibrium point for PA12 GF30
Optimal strategy: lowest feasible temperature + shortest required insulation
The core principle is to select the lowest feasible heat input and the shortest necessary dwell time while ensuring the bonding rate requirement is met. A temperature that is too low → high viscosity and suppressed enrichment; however, molecular diffusion becomes insufficient → resulting in poor soldering; a temperature that is too high → sufficient diffusion occurs, but resin migration intensifies → leading to enrichment. The intersection region between these two curves represents the optimal process window, which must be precisely defined through the combined application of OCT, air tightness testing, and durability verification.
▎ For mass production, the A-grade weld seam shall serve as the acceptance criterion; the ideal S-grade standard is not mandatory. Grade B components must undergo aging verification before being approved for release; Grade C components are prohibited from proceeding to the next stage even if their airtightness test passes.
epilogue
In the laser welding of PA12 high-glass fiber composites, the core challenge lies in balancing "glass fiber enrichment" against "weld seam bonding strength." The interference-fit constant-pressure configuration prevents the driving force for phase separation from being relieved; therefore, we must employ precise temperature control and OCT inspection to suppress the development of an enrichment layer into a continuous through-layer.
Summary in three points: ① The glass fiber enrichment layer constitutes a congenitally weak zone in the weld seam, which can disrupt molecular chain entanglement and introduce potential durability risks; ② The enrichment layer is highly sensitive to temperature fluctuations, where micro-gap connectivity resulting from thermal shock may lead to leakage; ③ OCT inspection serves as an irreplaceable means for identifying this latent defect, and each product must have its own independent locking mechanism for process parameters.
 Home
Home Products
 Telephone
 Message


