




An airtightness test can determine whether there is a leak at present, but it is difficult to ascertain exactly what structure is formed within the weld seam. Recently, we conducted extensive testing and inspection experiments, leveraging the vast amount of data collected to uncover some intriguing findings. Based on the OCT batch inspection data from two sets of thermal management multi-port valves, this paper aims to establish a comprehensive analytical framework: progressing from defect detection to the quantitative characterization of weld seam structures, defect location analysis, and welding process traceability.
Data Note: This study utilizes only two sets of anonymized samples that were welded by the client. Both materials are PA66+GF30. Sample A consists of 30 four-way structural samples, which were welded using a fixed-power welding method with collapse amount feedback recorded; Sample B consists of 40 eight-way structural samples, which were welded using a constant-temperature quasi-synchronous laser method with collapse amount feedback recorded. The product structures, process configurations, and evaluation thresholds differ between the two sample sets; therefore, this study does not rank the products in terms of quality or performance, but rather aims to establish an analytical methodology.
Caption: OCT detection principle
OCT (Optical Coherence Tomography) is a non-destructive tomographic imaging technique based on the principle of low-coherence interference. Its core operating principle involves light emitted from a near-infrared broadband light source being split into two paths by a beam splitter – a reference arm and a sample arm. The light from the reference arm returns after reflecting off a mirror, while the light from the sample arm is incident upon the interior of the weld joint, where backscattering or reflection occurs at interfaces at various depths within the weld joint. An interference signal detectable by the detector is generated only when the path difference between the returning light waves from the two arms is less than the coherence length of the light source; by performing point-by-point depth-scan (A-scan), the reflectance–depth distribution at each position can be obtained; these data are then stitched together through continuous lateral scanning (B-scan) to reconstruct a tomographic cross-sectional image of the weld joint.
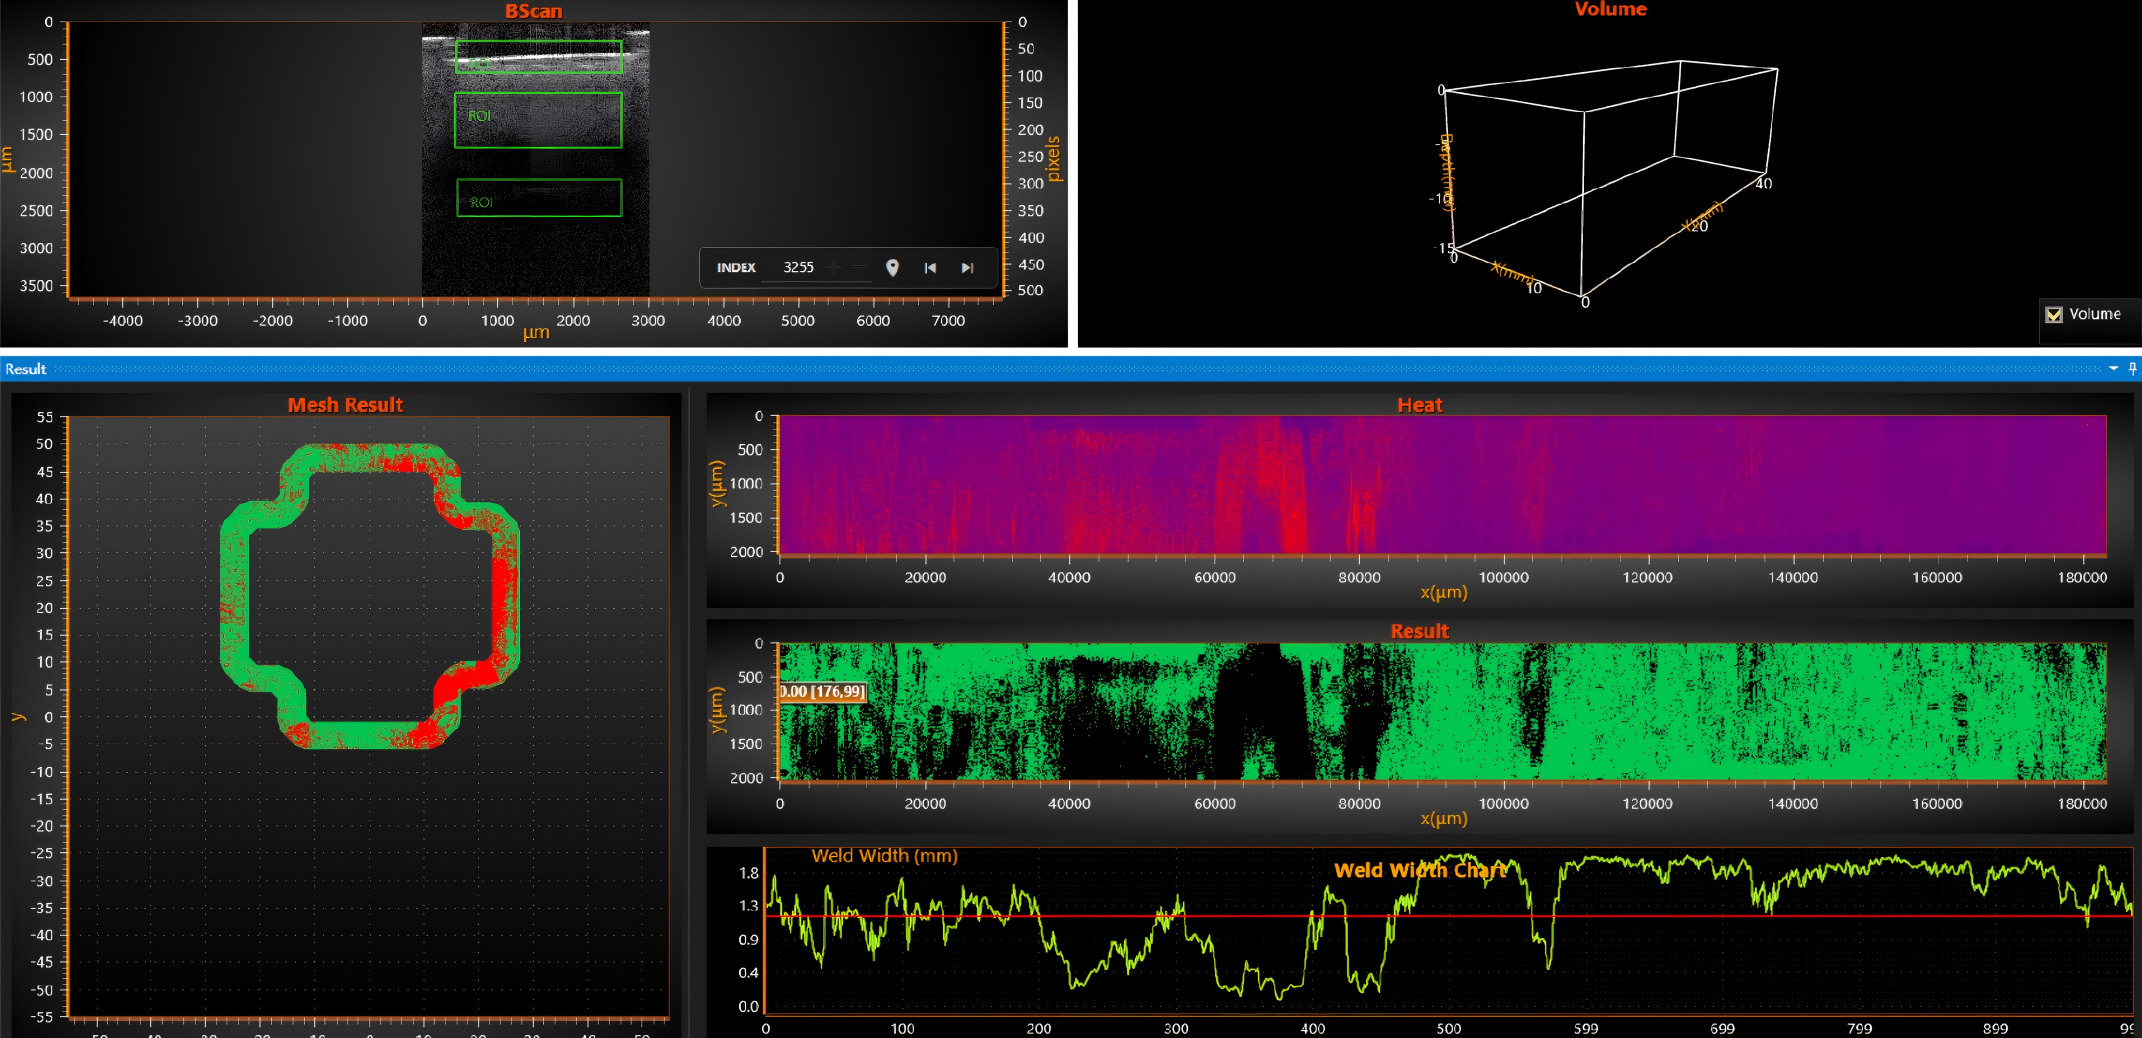
Figure 1 | Screenshot of scan results
In plastic laser welding, the optical properties of the weld interface are sensitive to OCT signals: in areas with good fusion, the refractive index at the interface changes continuously, resulting in weak scattering signals and uniform images; whereas at structural anomalies—such as porosity, micro-gaps, glass fiber-rich layers, or non-welded zones—the refractive index undergoes a sudden change, leading to significant enhancement of scattering or reflection, which manifests as high-contrast boundaries or grayscale variations in the cross-sectional imaging. The eight indicators described in this report (Surface Position Offset, Surface Burn, Intermediate Layer Glass Fiber Porosity, Poor Weld Quality, Bottom Layer Burn, Penetration Ratio, Shortest Effective Weld Width within the Weld Zone, and EWR) are precisely quantitatively assessed based on these structural characteristics observed in cross-sectional imaging.
OCT detection results are solely responsible for revealing structural differences in weld cross-sectional imaging.
The eight indicators presented in this report reflect differences in the imaging characteristics of the weld's internal structure (e.g., whether the interface is continuous, the presence of an abnormal scattering layer, or the size of the effective fusion zone), representing non-destructive testing conclusions at the structural level.
The structural variability observed in this report, along with its correlation to durability and other quality testing procedures (such as blast pressure, airtightness, fatigue cycling, high-and low-temperature impact, and wet-heat aging), was not subjected to corresponding analysis or verification in the present study.
Therefore, this report cannot be directly used to infer or guarantee the long-term service reliability of a product; if OCT structural differences are to be used as a basis for determining durability performance or for approving mass production, a separate study should be conducted to establish the correlation between structural differences and durability test results (it is recommended to select representative parts to create a mapping between OCT indicators and durability test results); prior to establishing such a correlation, the OCT conclusions should be regarded solely as a reference for structural quality assessment and cannot substitute for any durability or functional validation tests.
01 First, let's look at the conclusion: the weld joint of the multi-way valve cannot be fully explained by a single indicator.
The commonality between the two sample groups is straightforward: according to their respective acceptance criteria, both parties confirmed that all samples had passed the air-tightness test. However, under the OCT testing criteria, no workpiece met the requirement of passing all indicators in a single test. The true value lies not merely in receiving a "NG" result, but in identifying the underlying structural type behind that rejection.
The primary issue with Sample A is the overall inadequacy of the weld joint structure: among the 30 specimens, 25 exhibited a through-hole proportion exceeding the allowable limit; for 29 specimens, the minimum effective weld width was below the required specification; and the average EWR value was only 44.4%. This indicates that the problem is not merely an isolated defect, but rather reflects an overall weakness in the effective connection structure.
Sample B exhibits another typical phenomenon: the EWR average value reached 79.2%; all 40 specimens met the specified lower EWR limit, yet the minimum effective weld width for all 40 specimens was below the required specification; additionally, 19 welds exhibited substandard weld quality exceeding the allowable limit, and 15 specimens displayed through-thickness defects. In other words, even when the overall weld joint area has reached a certain threshold, local continuity issues and weak points can still represent significant risks.
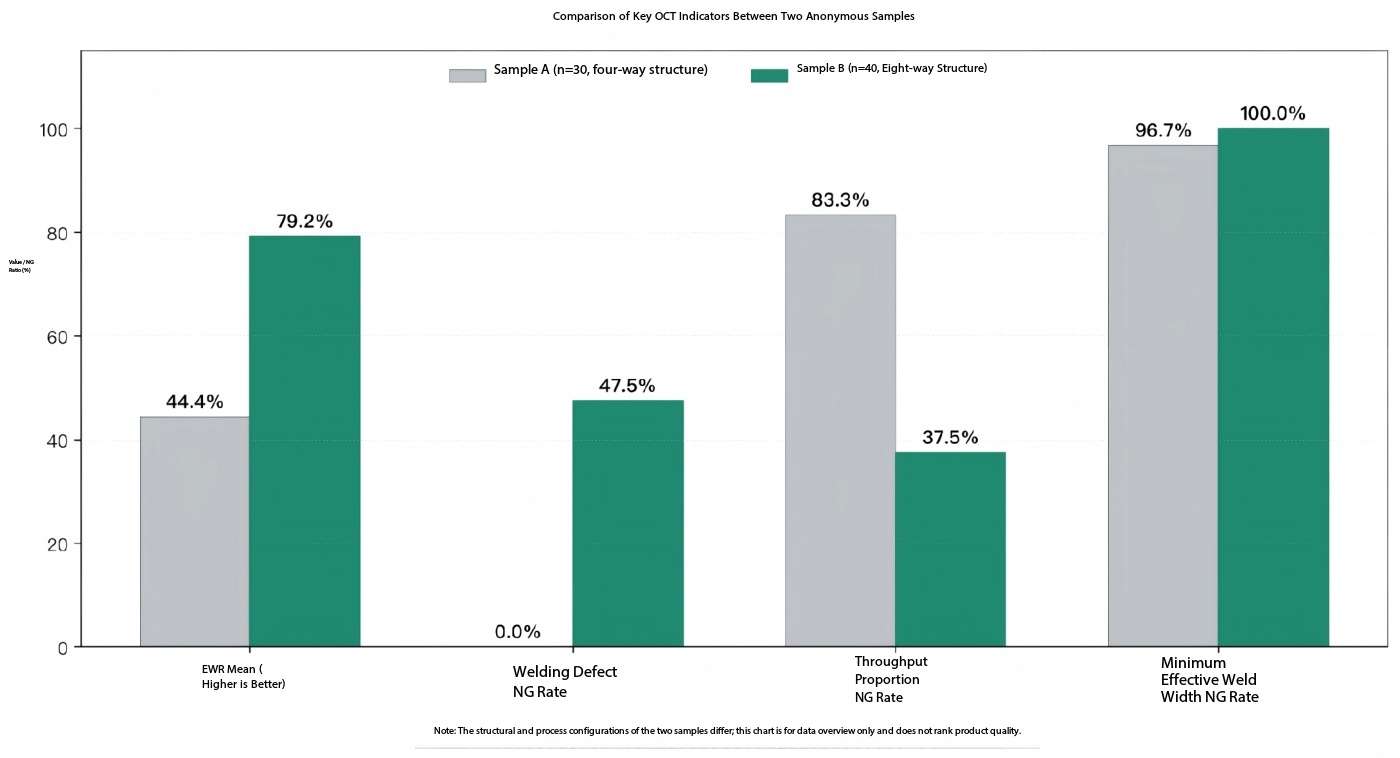
Figure 2 | Comparison of key OCT metrics between the two anonymous sample groups (higher EWR is better; lower abnormality rate is better)
To properly interpret this dataset, a layered analytical framework is required. In batch OCT testing, we adopt a five-tiered approach:
Analysis Level | Focus Metrics | Answered question |
Surface | EWR Effective Welding Rate | Is the total weld joint area sufficient? |
Line | Shortest effective weld width | Does continuous sealing pose a risk of through-type leakage? |
drop | Through-hole percentage, poor weld quality | Is there any local weld seam discontinuity, defect channel, or abnormal reflection? |
position | Defect density curve, heat map | Whether the defects are concentrated in start/stop, corner, overlap, or closure areas, and whether there is any pattern to them |
batch | Mean, Standard Deviation, CV, Trend | Does manufacturing with identical parameters truly result in a consistent weld seam structure? |
The data at the "batch" level best illustrates the fundamental difference between the two sample groups. For Sample A, both the EWR and the coefficient of variation (CV) for the throughput proportion exceed 45%, indicating high intra-batch dispersion; consequently, no consistent statistical patterns can be identified across these indicators. In contrast, for Sample B, the EWR coefficient of variation is only 8.1%, reflecting good intra-batch consistency. This difference in dispersion is clearly visible on the item-by-item trend chart:
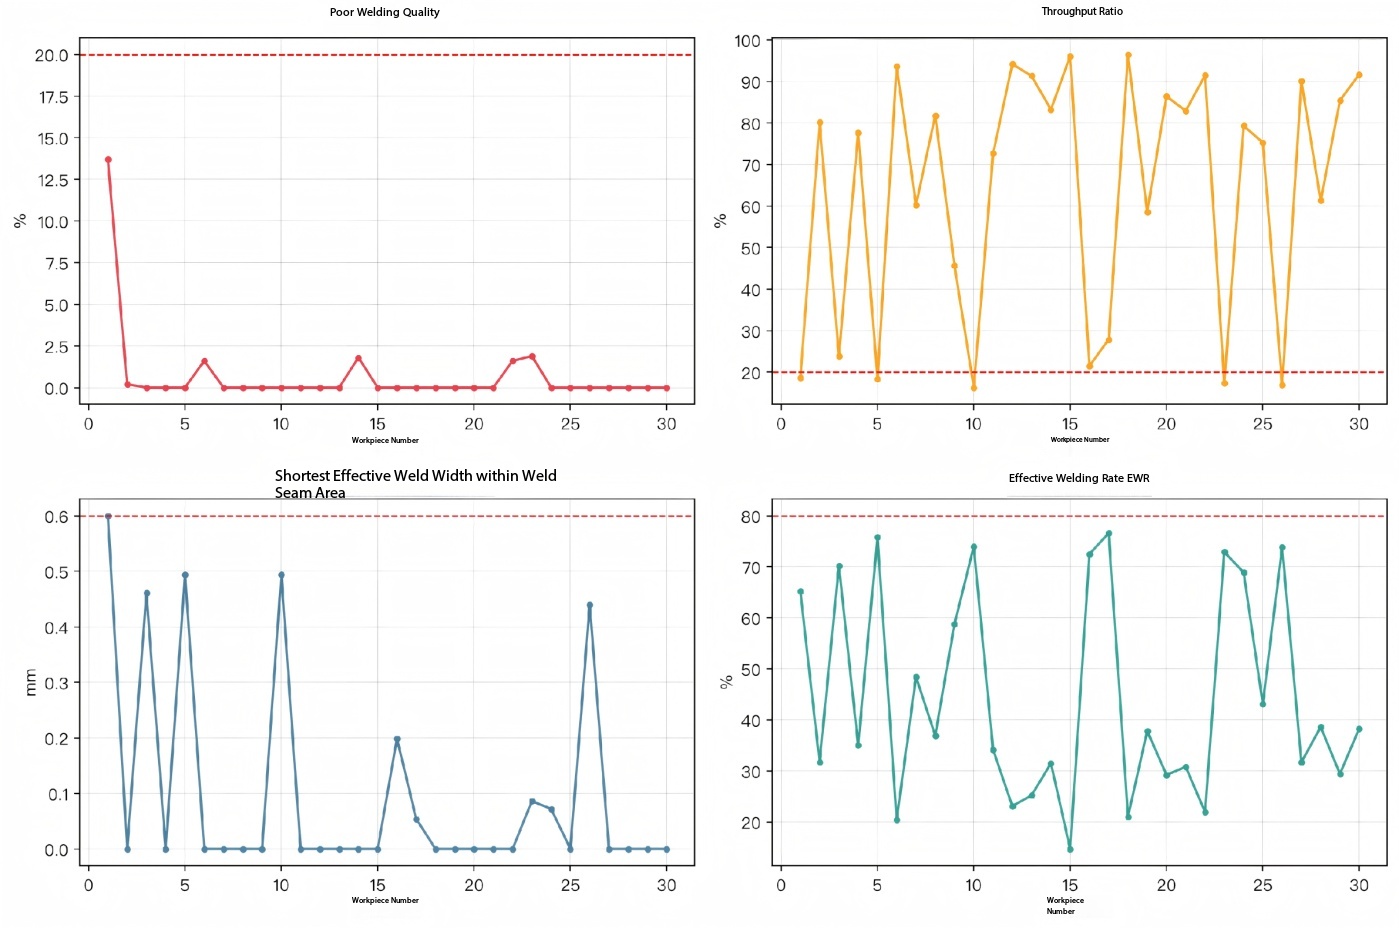
Figure 3 | Trend chart for four key performance indicators across 30 products in Sample A: Each indicator exhibits significant, individual-level fluctuations without any discernible pattern.
、
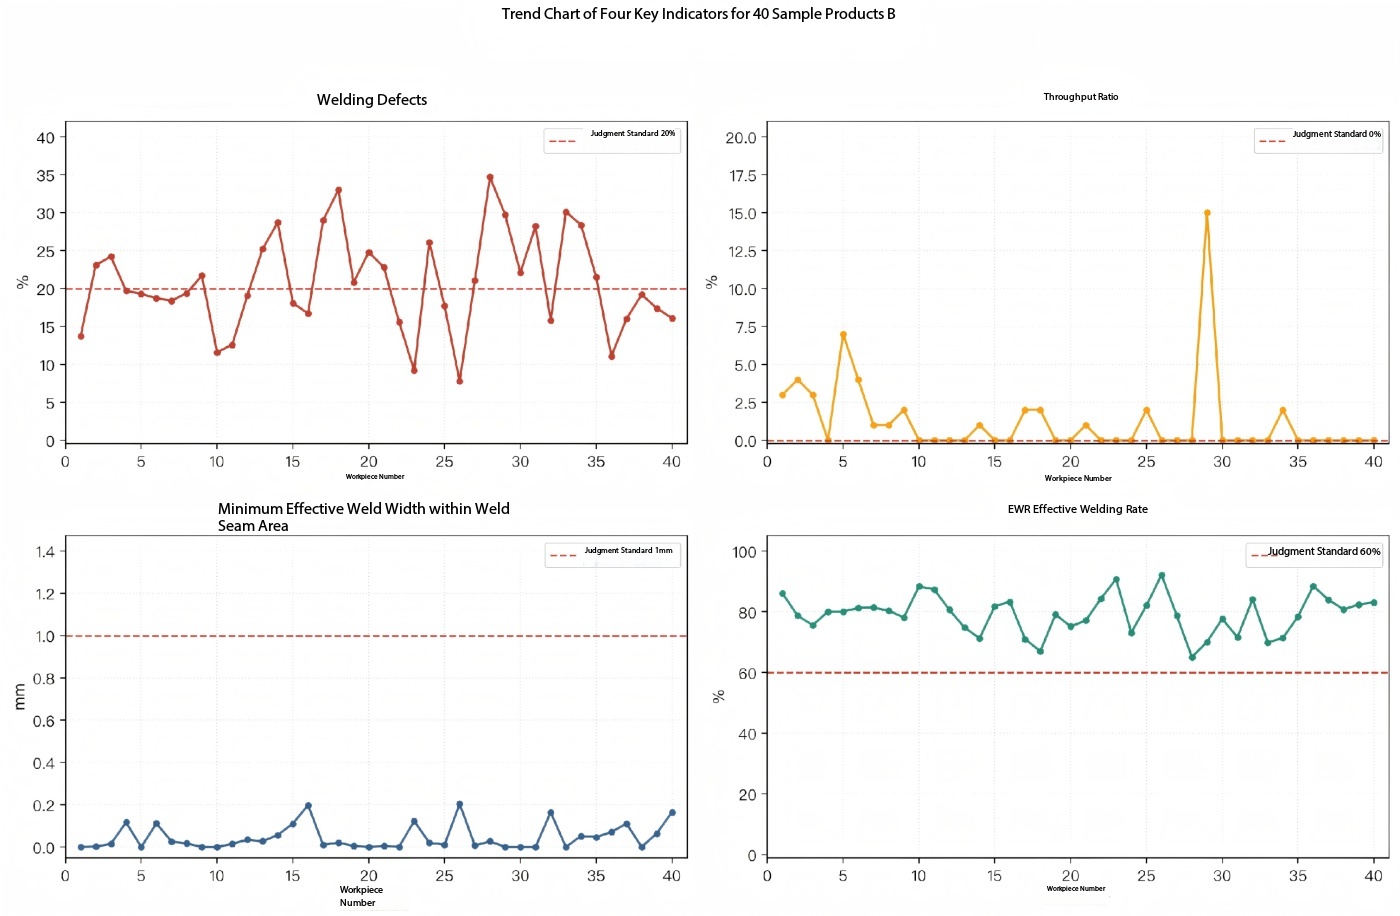
Figure 4 | Trend chart for four key performance indicators across 40 products in Sample B (same chart format): Intra-batch variability has narrowed significantly; however, the overall weld width remains below the acceptance threshold.
02 EWR: Consider the overall picture; the minimum effective weld width is determined by the shorter side.
Sample B is particularly worthy of discussion, as it serves as an excellent example of the "mean value trap." When examining EWR alone, the average value of 79.2% might lead one to assume that the overall condition of the welds is satisfactory; however, the average shortest effective weld width is only 0.046 mm, and the maximum value is merely 0.204 mm – both of which still fall significantly short of the required 1.000 mm specification.
EWR is essentially a surface-area-based indicator, as it reflects the proportion of the weld joint area; in contrast, the shortest effective weld width focuses on the weakest cross-sectional section of the continuous weld seam. For multi-port valve welds that serve both sealing and structural connection purposes, localized narrow necks, intermittent fusion, or through-holes often more accurately indicate the actual failure location than the average value does.
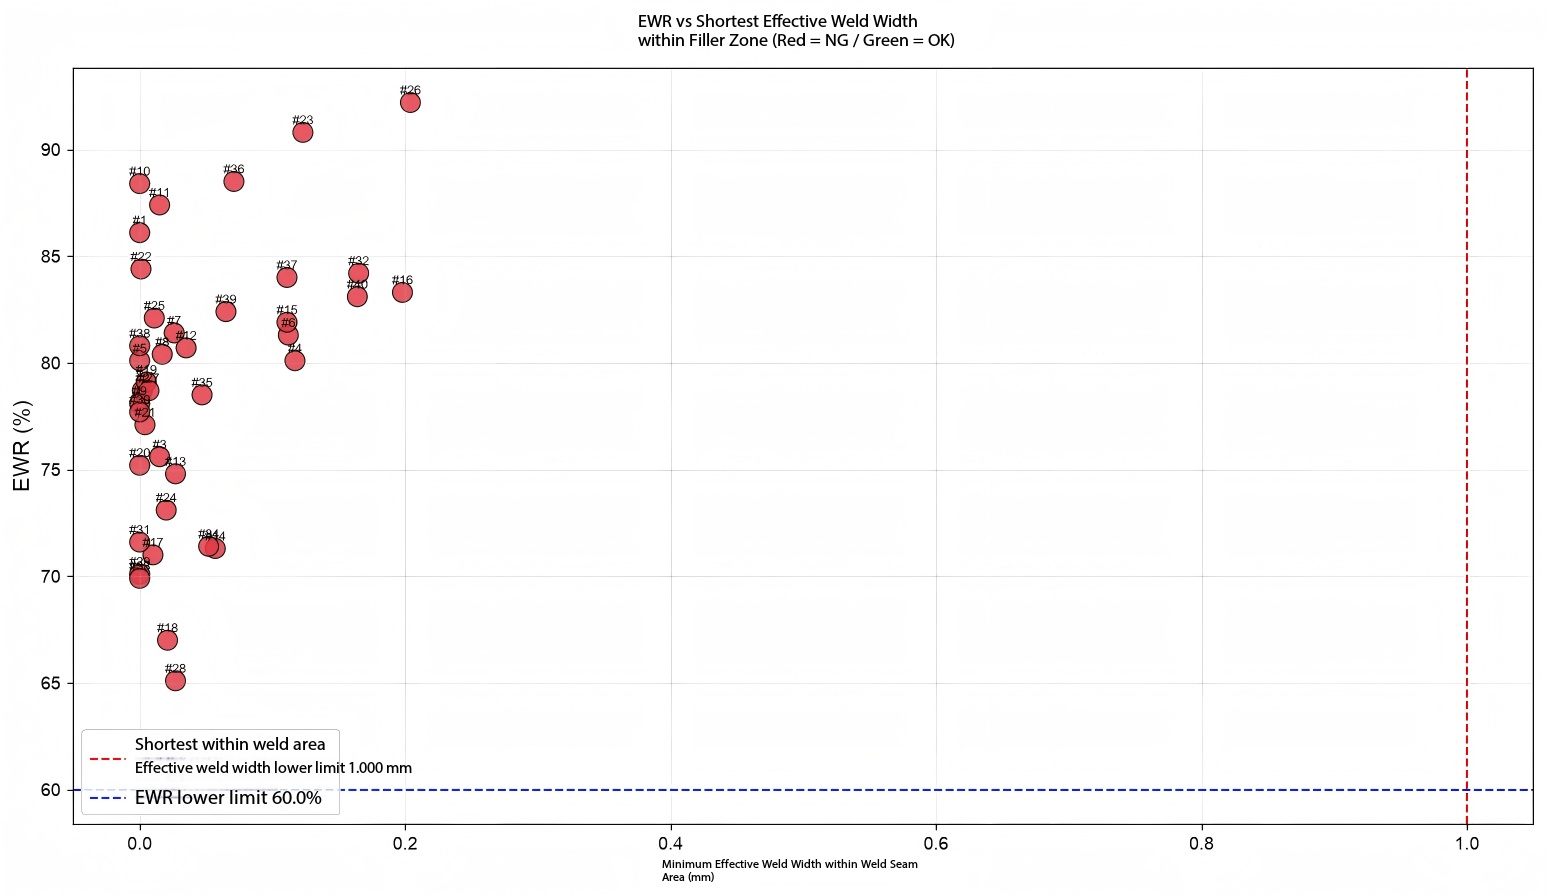
Figure 5 | The mismatch relationship between EWR and the shortest effective weld width in Sample B: While EWR generally meets the specification requirements, the weld width as a whole remains within the same insufficient range; there is no significant correlation between the two.
03 Inadequate penetration and insufficient weld width represent structural indicators of leakage risk.
In Sample A, the average percentage of welds lacking effective continuity reached 64.5%, with the highest value being 96.5%; the average shortest effective weld width was 0.097 mm, and 29 out of 30 specimens fell below the required threshold of 0.600 mm. These results indicate the presence of extensive regions within the welds where effective bonding has not been achieved; such defects may be amplified during subsequent air-tightness testing, blast testing, or thermal cycling tests.
In Sample B, the average penetration percentage is only 1.25%; however, since the acceptance criterion is set at 0.0%, any instance of penetration warrants attention. Additionally, the insufficient minimum effective weld width (40/40 pieces) indicates that, even if the overall weld bonding rate is not low, it is still necessary to further optimize the local weld width and continuity.
04 The defect location holds greater process-related significance than the number of defects.
The value of batch OCT inspection goes beyond simply identifying which specific part is non-conforming; more importantly, it involves unwinding the weld seam along its length to determine whether defects recur at the same location.
Sample A exhibits peak defect densities at positions of 3.5%,21.5%,28.5%,52.5%,72.5%, and 92.5%; among these, the peak defect density at approximately 92.5% in the tail closure region reaches 0.995, approaching full-segment abnormality. The segmented statistical analysis of Sample B also reveals that the defect density in the 0–20%,60–80%, and 80–100% segments is higher than that in the middle segment, with defects concentrated in the initial and terminal segments. Compared to Sample A, the positional variation pattern in Sample B is more pronounced; consequently, the manufacturing process appears more controllable.
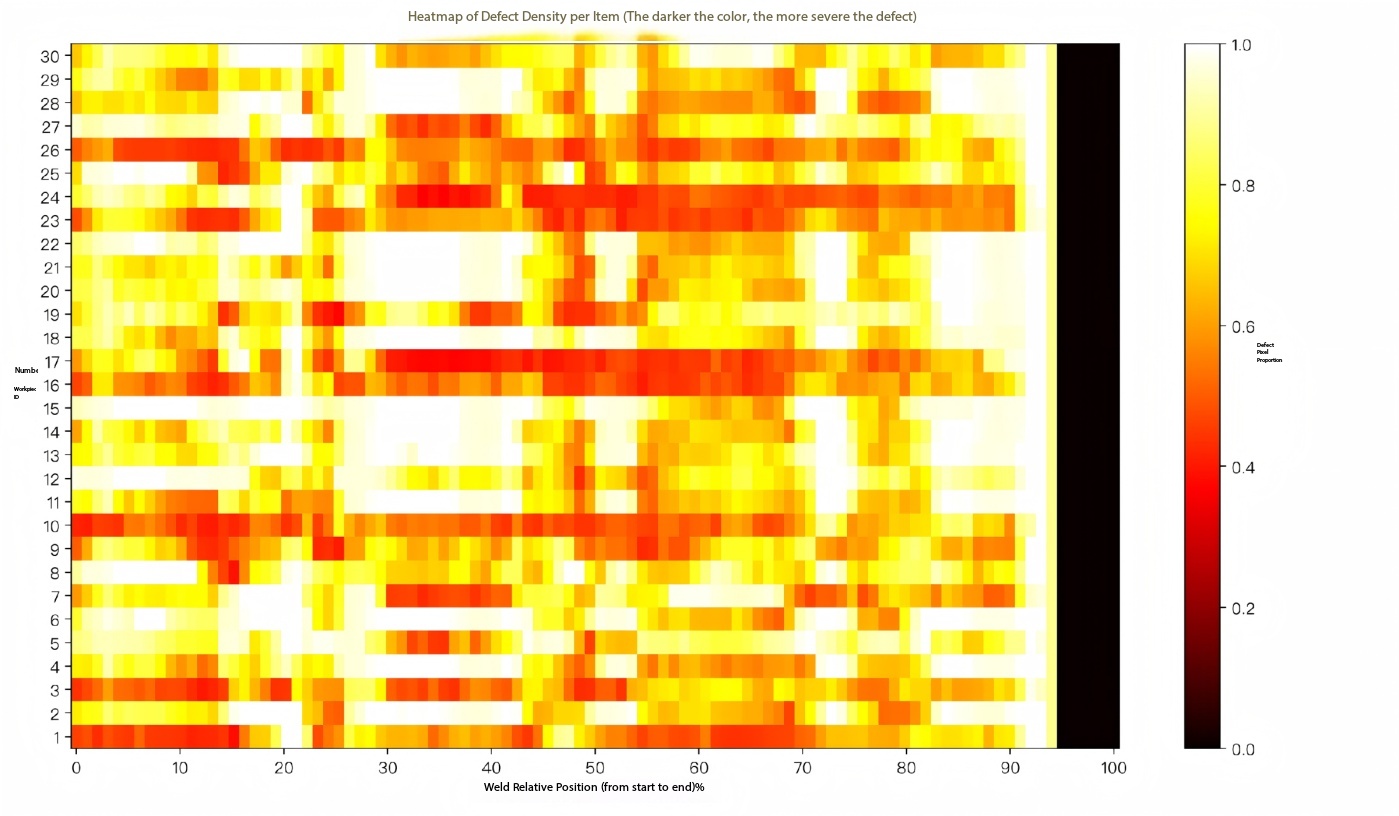
Figure 6 | Thermal map of weld seam defect locations for 30 products from Sample A (vertical axis: workpiece number; horizontal axis: weld seam relative position (0–100%))
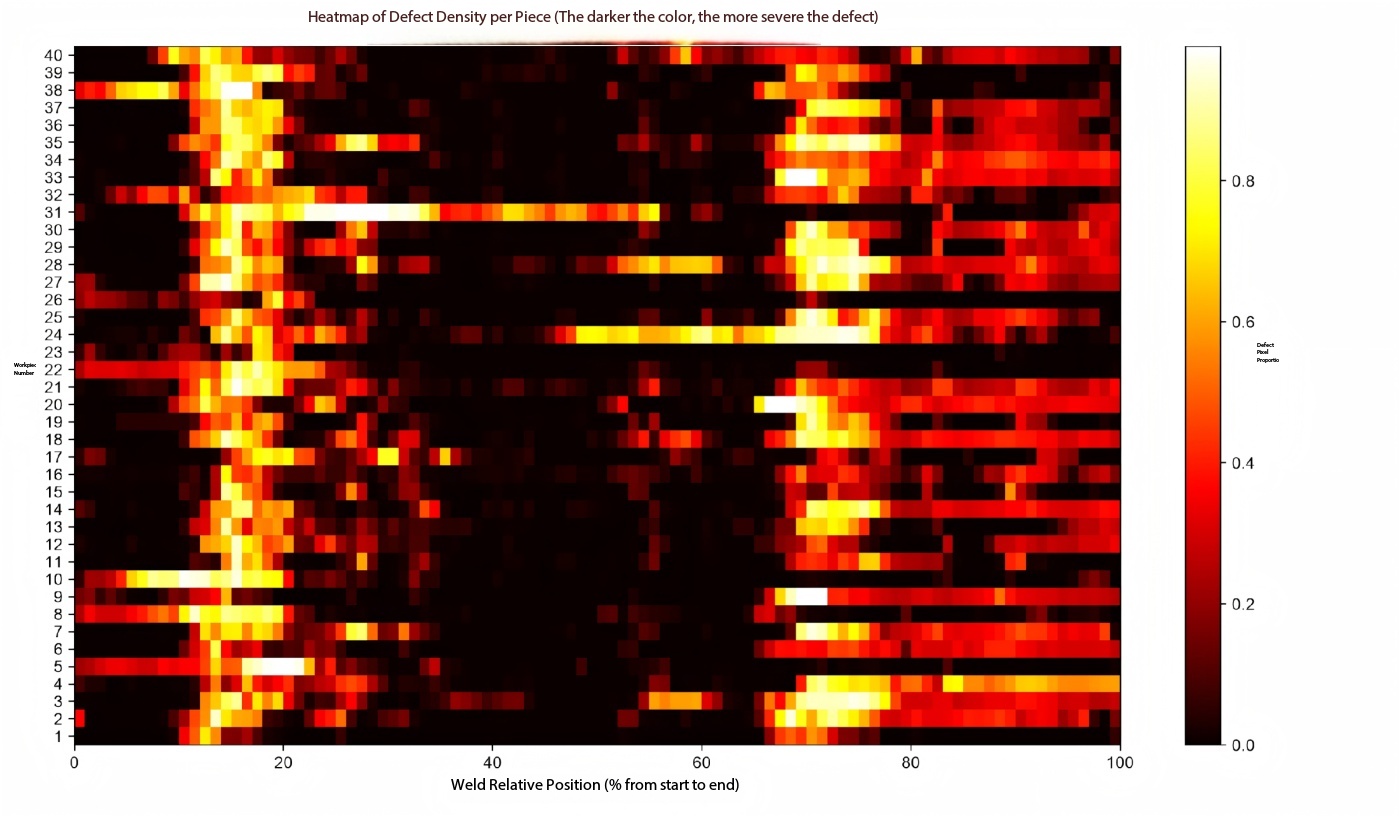
Figure 7 | Thermal map of weld joint defect locations for Sample B (40 products; same diagram): Defects are concentrated in the front and rear sections as well as at a few fixed locations.
This positional analysis approach shifts the focus from "random material defects" to "welding process-related issues": factors such as laser start/stop events, power ramp-up/ramp-down, mirror speed, scan overlap, closed-path trajectory, fixture clamping force, geometric corner angles, and local wall thickness variations – particularly changes in weld point temperature – can all leave distinct traces on the defect location map. Once this positional fingerprint is identified, targeted corrective measures can be implemented precisely. As a result, OCT batch inspection demonstrates significant value:
From a single NG to a "Welding Quality Map"
OCT technology enables the visualization of weld seams from individual products. Horizontal axis: weld seam position; Vertical axis: product identification number; Color: defect density. The resulting output is a weld seam defect thermal map (see figure above). Among the second group of 40 products, although the overall EWR is not particularly low, the aggregated thermal map data reveals a very distinct pattern: the middle segment is relatively stable, whereas the front and rear segments are significantly worse. Particularly in the 80–100% range, the probability of defect occurrence reaches 62.0%. Such data is no longer merely about "whether a specific product contains defects"; it begins to provide valuable insights to production engineers:
The welding process itself involves location-dependent quality variations.
What does it truly mean when these two experiments are combined?
By comparing the two sets of experiments together, one can draw a highly valuable conclusion.
Observation Dimension | sample bookA | sample bookB |
Overall welding quality | Significant shortcoming | Significant improvement |
EWR | Average: 44.4% | Average: 79.2% |
Minimum weld width | Significant shortage | The 40/40 target remains unmet. |
run through | 25/30 | 15/40 |
Poor welding | relatively less | 19/40 |
Positional Pattern | non constat | clear |
primal problem | Overall structural weakness | Poor local continuity + positional defect |
05 OCT: How to transform detection equipment into a process analysis tool
The traditional quality control process typically involves performing an air tightness test after welding is completed; if any non-conforming (NG) findings are detected, the parameters are then adjusted accordingly. With the integration of OCT, this process can be further refined as follows: after welding, weld seam structural images are acquired to quantitatively measure EWR, weld width, penetration, defect density, and defect location distribution; these measurements are then inversely correlated with welding temperature, speed, pressure, fixture parameters, material properties, and thermal history.
OCTfind | Tracing Direction |
EWR overall level is relatively low. | Insufficient total thermal input, fluctuating absorption rate/light transmittance, excessive processing speed, or spot/focus deviation |
Insufficient minimum effective weld width | Insufficient local contact, uneven clamping, geometric clearance, insufficient trajectory width or energy distribution |
Total length exceeds the limit | Local weld seam discontinuities, trajectory interruption, insufficient lap length, contamination, or abnormal material condition |
Start/End Defect Concentration | Power ramp-up/ramp-down, mirror acceleration/deceleration, closed-loop trajectory, thermal accumulation or compensation strategy |
Large intra-batch discrete parameter variation | Clamping consistency, material batch, drying condition, tooling thermal history, equipment stability |
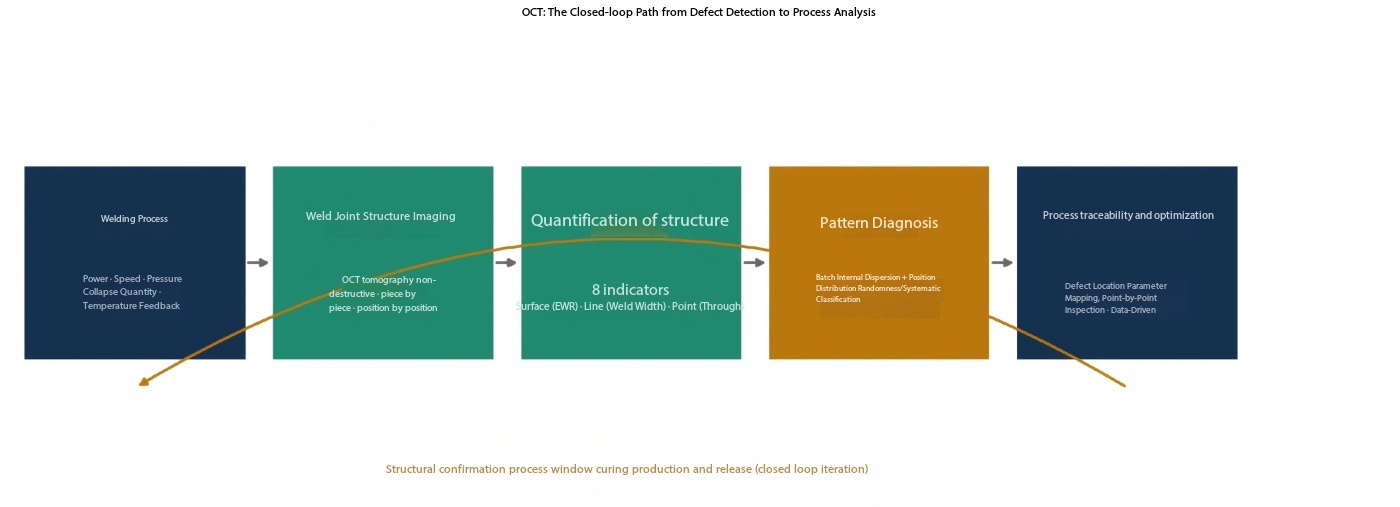
Figure 8 | The closed-loop pathway of OCT – from adverse event detection to process analysis
06 Implementation Recommendation: Build the structural window first; then discuss mass production approval.
First, during the process development phase, it is not advisable to use OCT solely as an end-point inspection tool. A more effective approach is to simultaneously record power, speed, pressure, collapse amount, temperature feedback, and OCT structural parameters, thereby establishing a relationship between the material, process, and weld structure.
Second, during the mass production phase, OCT can perform structural-level comprehensive inspection and trend monitoring: by retaining images or feature values for each product, it not only determines whether an individual item is abnormal but also monitors whether the defect location has shifted or whether the intra-batch variation has increased.
Third, the OCT threshold must be defined in a project-based manner. The criteria for determining compliant images vary depending on the material, color, filler proportion, valve body structure, weld width, and failure mode. For structural performance indicators to be truly applicable for product release, they must also be correlated with validation test results—including air tightness, burst strength, fatigue resistance, high-and low-temperature cycling, and high-and low-temperature aging tests.
Conclusion: The areas that truly require digitalization are weld joint structures.
Air tightness testing indicates whether the product is currently leaking; OCT further reveals what specific structure has been formed during the welding process.
From identifying defects in a single product to uncovering patterns across an entire batch, and then to pinpointing the root causes within the production process.
The value of OCT extends beyond merely "detecting defects"; it enables the transformation of invisible weld seam structures into quantifiable, statistically analyzable, and traceable data. This represents the most promising application area for OCT inspection technology – particularly in the thermal management of multi-port valves made of plastic, as well as in other high-requirement laser plastic welding applications: converting the invisible internal weld seam structure into continuous, quantifiable, and statistically analyzable data.
Final establishment of a data chain: Materials → Process → Welded Joint Structure → Product Performance → Long-Term Reliability.
This may well represent the true value of OCT in the plastic laser welding of multi-port thermal management valves.
 Home
 Products
 Telephone
 Message


