



When the collapse amount becomes the core—even the sole—performance metric for plastic laser welding, the accuracy of measuring this collapse amount becomes a critical issue. In previous publications, we have discussed the mechanisms underlying the formation of collapse amount, as well as strategies for its control, including precision pressure application via electro-hydraulic cylinders, closed-loop control using μm-level displacement sensors, and integrated glass pressing processes.
However, recent OCT inspection results from a batch of mass-produced components have brought to light a more pressing issue: even when stringent controls have been implemented at the equipment end—such as using displacement sensors with μm-level resolution, employing precision pressure control for electro-hydraulic cylinders, ensuring glass press-fitting to prevent structural deformation of the parts, and setting a collapse threshold as the welding cutoff criterion—the collapse measurement values themselves can still be "inaccurate." By "inaccurate," we do not mean that the sensors themselves are faulty; rather, it means that a single collapse measurement value may correspond to different weld seam conditions. The sensors may detect displacement, but fail to detect fusion.
The amount of collapse is a "process quantity," whereas the weld cross-section is a "state quantity."
I. Experimental Design: Same degree of collapse; four parameter sets
The following set of experiments was conducted on mass-produced specimens from the EPB project, using PBT+GF30 (30% glass fiber reinforced) material and employing quasi-synchronous laser welding. The fixing conditions for all four specimens were identical: collapse value of 0.39 mm, trigger pressure of 1700 N, pressure hold melting depth of 0.01 mm, welding pressure of 2000 N, and pressure hold time of 4s; only the welding temperature and power settings were adjusted.
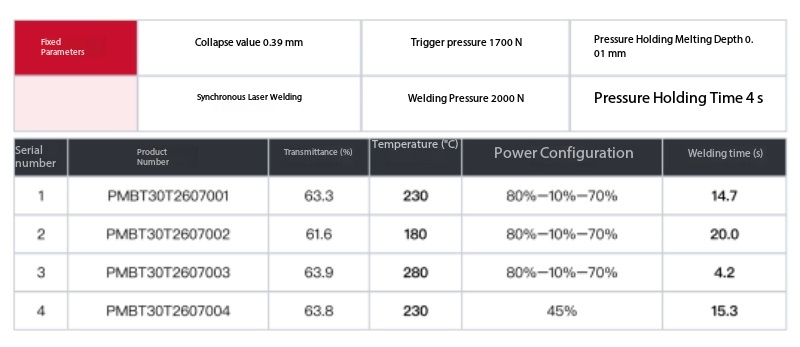
Figure 1: Fixation parameters and process variables for the four sample groups
It is first necessary to clarify the relationship among these four parameter sets: they do not constitute four independent process recipes, but rather form a single-variable control structure. Sets 1#,2#, and 3# differ only in their temperature settings (230 °C / 180 °C / 280 °C); set 4# employs a fixed laser power (to enforce collapse rate control), a similar welding duration (15.3 s / 14.7 s), and a comparable total laser output power, with the sole difference lying in the power delivery mode—set 1# utilizes a constant-temperature closed-loop feedback configuration, whereas set 4# employs a constant 45% output without power compensation. This experimental design ensures that each cross-sectional variation can be attributed to a specific process variable. Consequently, this study conducts only horizontal comparative analyses and does not rank the parameters by performance.
The upper surface transmittance of the four products was 63.3%,61.6%,63.9%, and 63.8%, respectively, with fluctuations within 2.3 percentage points, indicating good optical consistency of the materials. This is critically important: subsequent variations in cross-sectional characteristics cannot be attributed to material batch differences or fluctuations in transmittance.
There is one additional column in the table that warrants particular attention: "Welding time." This parameter is not a user-defined setting, but rather the actual duration required for the system to reach a collapse depth of 0.39 mm. In other words, while the collapse depth threshold for all four sample groups is identical, the pathways leading to reaching this threshold differ entirely.
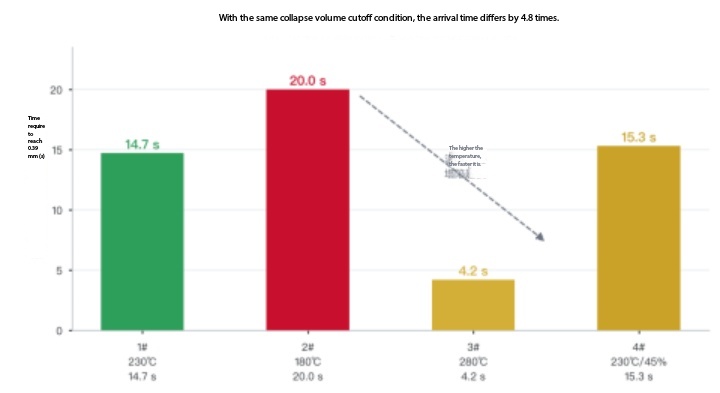
Figure 2: Under the same collapse threshold condition, the actual arrival times of the four sample groups differ by a factor of 4.8.
At 280 °C, the process takes only 4.2 s, whereas at 180 °C it takes 20.0 s—a difference of 4.8 times. The collapse extent serves as the displacement endpoint, while the quality of the weld seam depends on how much energy the interface absorbs, how much melt flows, and how far the molecular chains diffuse during the interval from the start to the end point. Even with the same endpoint, the underlying process can differ entirely.
It should first be noted that a prerequisite for this inspection is that this batch of products has not yet undergone quality threshold configuration; consequently, the OCT inspection interface is in the "Parameters Not Configured" state. The values displayed on the interface—such as an effective weld seam rate of 50% and an effective weld width of 1.860—represent default values of the device template rather than the acceptance specifications for this specific product. Therefore, this study does not rely on the interface default thresholds for pass/fail determination; all conclusions are based solely on the actual morphology of the cross-sectional images and the relative metrics referenced within the same figures.
II. Analyze the cross-section: the four slices of BScan
The most direct way to determine whether welding has been completed is to examine the weld cross-section. In an OCT B-scan image, the cross-section can be divided into four layers from top to bottom; each layer corresponds to distinct physical characteristics and serves different purposes in quality grading.
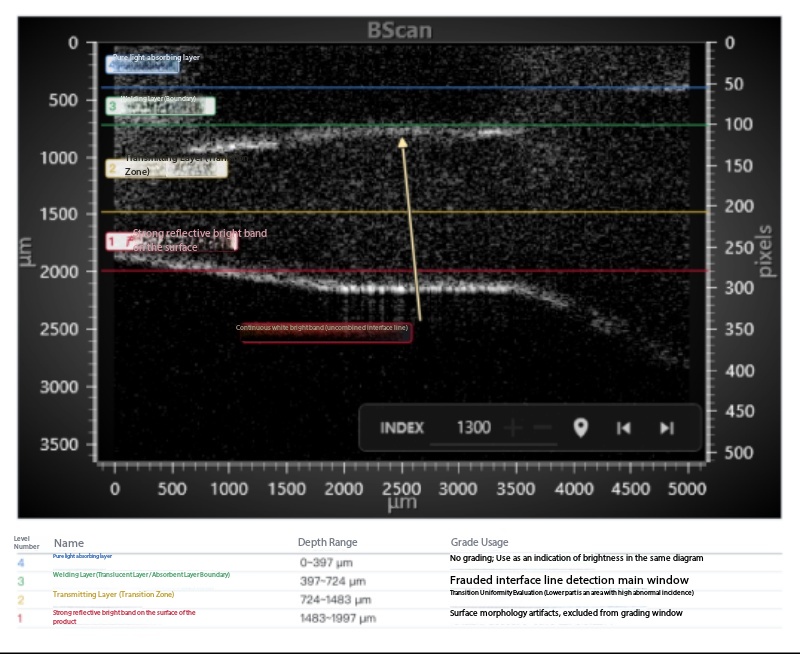
Figure 3: Four-layer structure of the BScan cross-section (raw OCT software screenshot; no enhancement applied; color lines indicate layer boundaries; using the 180 °C test specimen as an example, the positions of the lack-of-fusion interfaces are marked in the figure).
Particular attention should be paid to the interface between layer ③ and layer ②—this region constitutes the original bonding surface between the light-transmitting layer and the light-absorbing layer, i.e., the theoretical "welding interface." If the welding interface is fully fused, the scattering characteristics between the two layers exhibit a continuous transition, and no distinct line is observable in the cross-section; if the interface is not fused, a continuous, bright, laterally oriented reflective line will appear at this position.
The presence of a continuous bright line at the weld interface is the most direct and least easily falsifiable piece of evidence for determining whether fusion has occurred.
Groups 3 and 4 of cross-sections, and four morphological characteristics
Using the same sampling protocol, batch scans were performed on the cross-sections of four sample groups (approximately 5,400 images per group; 109 images were randomly selected from each group at equal intervals of 50 based on their numbering, totaling 436 images). Representative images of the four cross-sections are shown below.
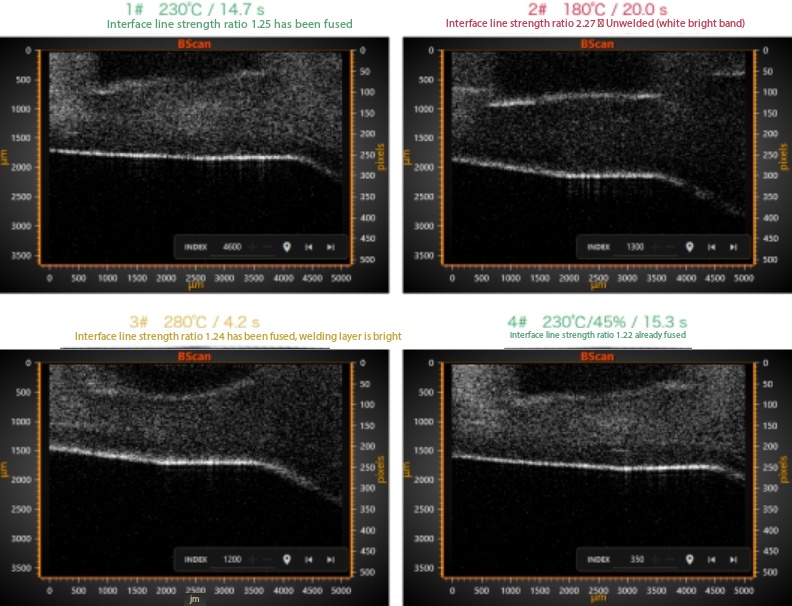
Figure 4: Original BScan cross-sectional screenshots of the four sample groups (the depth axis, the scan position axis, and the INDEX numbering are all based on the original annotations from the OCT software; no enhancement processing has been applied).
· 1# 230 °C: Near the welding interface, there is a natural speckle that transitions continuously into the light-transmitting layer, and the interface approaches full fusion;
· 2# 180 °C: A continuous, flat, and bright white band appears at the weld interface (at a depth of approximately 0.7–0.8 mm); the signal beneath the interface is significantly obscured; the boundary of the weld layer remains intact; and clear lack of fusion is observed.
· No.3, 280 °C: Similarly, no interface line is observed, but the entire weld layer exhibits a distinct arc-shaped depression—a trace resulting from excessive energy input and significant material collapse;
· No.4: 230 °C / 45%: No interface line; the cross-sectional appearance is similar to that of No.1. Its temperature, welding time, and total laser output power are all comparable to those of No.1; however, no power compensation was applied—consequently, the brightness of the weld layer is slightly higher than that of No.1.
The amount of collapse under the control of welding equipment was identical; however, the evidence provided by the four cross-sectional analyses differed.
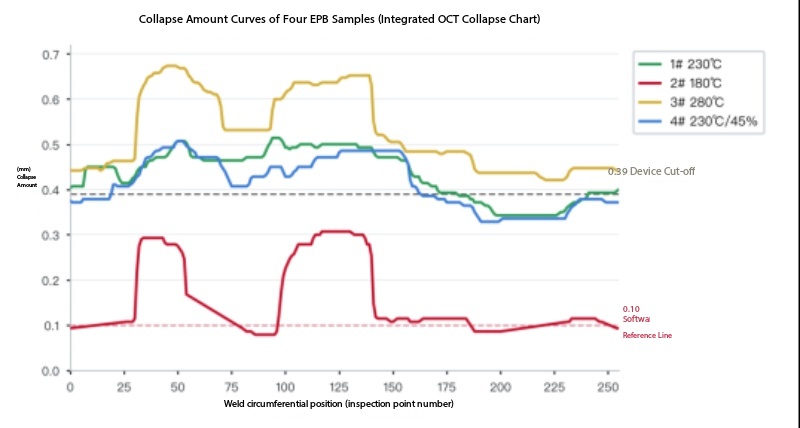
In Figure 5, the X-axis represents the expansion along the weld seam; as can be seen from the figure, the actual collapse amount exhibits a strong correlation with temperature. Parameters 1 and 4 are similar, and their collapse rates also tend to converge.
IV. A bright white band at 180 °C: a false "fingerprint" of collapse
This set of data is the most noteworthy for further analysis in this experiment. Upon zooming in on the cross-section of the 180 °C group, a continuous bright white band spans the entire scan line at the welding interface (along the lower edge of the welding layer, at a depth of approximately 0.7–0.8 mm).
It does not consist of isolated spots, but rather exhibits horizontally continuous regions of strong reflection; on the grayscale profile, the peak line brightness at this location is approximately 1.94 times the reference brightness of the light-transmitting layer in the same image, approaching the intensity level of strong reflective bright bands on the product surface—i.e., the intensity range observed when OCT light undergoes specular reflection on the outer surface of the part. According to the criteria employed for batch analysis (peak line-to-band intensity ratio ≥ 1.4 and horizontal continuity ≥ 0.18), this bright band is classified as a continuous, unmerged reflective interface line.
The results of the online batch sampling were equally definitive: in the 180 °C group, among the 109 sampled cross-sections, all 109 specimens exhibited this interface line, yielding a detection rate of 100%. This was not an occasional defect in individual specimens, but rather a systematic, batch-wide failure of fusion.
Why does a "bright white band" remain at the interface under low temperatures?
The key factor lies in the material state. The melting point (Tm) of PBT+GF30 is approximately 225 °C. When the welding temperature is set to 180 °C, the interfacial temperature remains well below the melting point, and the material exists in a highly elastic state—it has not yet entered a viscous flow state capable of flow.
However, under a welding pressure of 2000 N, materials in their high-elastic state still undergo yield deformation. This leads to the following scenario: the displacement sensor indeed detects a collapse amount of 0.39 mm, and the system shuts down normally according to the shutdown criteria; yet within this 0.39 mm displacement, a significant portion consists of elastic deformation and high-elastic-state yield deformation. After welding ceases and the pressure is released, this deformation portion undergoes elastic recovery. Consequently, the interface is re-separated during the cooling and recovery processes, forming an extremely thin micro-gap. When OCT light traverses this micro-gap, it encounters a sudden change in refractive index, which generates strong reflection—this is the origin of the bright white band observed in the cross-sectional image.
White bright band = interface retracted = reading collapsed; physically, the soldering is incomplete.
This is the cross-sectional fingerprint of "pseudo-collapse." It is distinct from single-factor explanations such as "excessive power" or "suboptimal spot quality": the same reading of 0.39 mm can result from effective melting depth at 230 °C, whereas at 180 °C it may stem from the yield point in the high-elastic regime. In the former case, the cross-section exhibits a continuous transition of speckled patterns; in the latter, it displays a bright white band—while the process readings are identical, the underlying physical states are opposite.
V. Lateral differences among the five cross-sectional groups: none of the groups has yet reached optimal performance.
Conversely, for the three groups that did not exhibit a bright white band, their cross-sections were also not identical. The grading results of the 436 sampled cross-sections were compiled as follows:
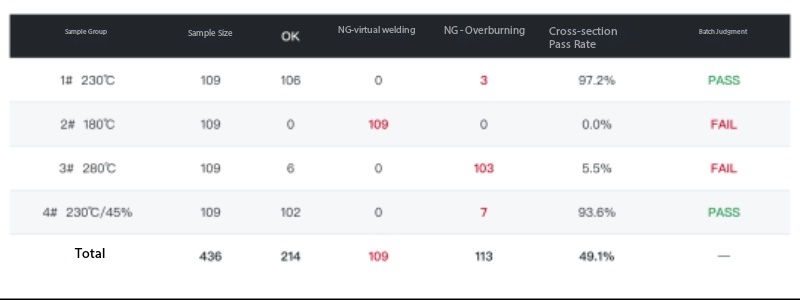
Figure 6: Batch grading results of cross-sections for the four sample groups (436 specimens sampled, step size = 50)
First, let us clarify what this table addresses: it addresses the question "Has the interface fused?" —this is a state assessment, not a parameter ranking. The differences among the four sets of grading results precisely demonstrate that, under different welding parameters, the test outcomes can vary.
1# 230 °C group: 106/109 passed; relative brightness of the welding layer, WeldBR, was 0.834 (the lowest among the four groups); transverse uniformity of the light-transmitting layer, latCV, was 0.43 (the most uniform among the four groups); the cross-section was overall clean.
Group 4 (230 °C/45%): 102/109 passed; seven light welds exhibited uneven transition, concentrated in the segments numbered 451–651 and 4301–4501, indicating a localized clustering. This suggests that these segments may have been affected by clamping or pressure fluctuations, warranting separate re-examination. Notably, its WeldBR value is 0.898, slightly higher than that of Group 1. Both groups were subjected to identical temperature settings, similar welding durations, and comparable total laser output power; the sole difference was that Group 1 employed segmented power compensation, whereas Group 4 utilized a constant 45% output, which accounts for the observed distinction in their weld profiles.
The differences in the 3# 280 °C group appeared in the opposite direction: although no interfacial line was observed (interfacial line strength <1.24, indicating no fusion), a distinct faint bright band emerged in the weld layer—the relative brightness of the weld layer (WeldBR) reached 0.978, and among the 109 specimens, 67 exceeded the batch reference line threshold of 0.95, making this group the highest among the four; meanwhile, the lower portion of the light-transmitting layer exhibited a latCV value of 0.61 and a bright particle density of 8.1%, both significantly higher than those in the other groups. Taken together, these findings indicate slight overburning caused by excessive welding energy, rather than lack of fusion. The collapse extent reached its threshold prematurely at 4.2 s, and this group exhibited the most abrupt process profile, yet its fracture surface was the most uneven among all groups.
Let's summarize the differences across the four groups:
· No.2, 180 °C: Insufficient temperature results in poor interfacial fusion, leaving a continuous bright white band across the cross-section;
· No.3, 280 °C: At excessively high temperatures, although the interface has fused, both the brightness of the weld layer and the uniformity of the light-transmitting layer increase significantly;
· No.4, 230 °C: The temperature is appropriate, but no compensation was applied to the constant power; the brightness of the weld layer is higher than that of No.1, which underwent segmented compensation.
· Sample 1@230 °C: The cross-section is the cleanest, but it is merely one sample within this set of single-variable controls; it is not the definitive answer.
To date, none of these four sets of parameters has reached an optimal state suitable for finalization—each set addresses only one variable, and each still exhibits signs that further convergence is required.
VI. What exactly is being measured in the settlement measurement?
Examining the readings from the displacement sensor, the 0.39 mm deflection is actually composed of several components.
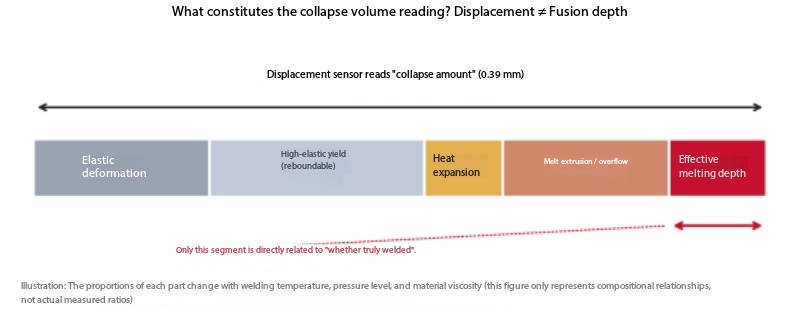
Figure 7: Component breakdown of the collapse measurement readings
Among these parameters, only the "effective fusion depth" parameter is directly related to "whether true fusion has occurred" —whereas in this set of process conditions, the pressure-retention fusion depth setting was set solely to 0.01 mm. In all other parameters, the focus was on "how much the part has been pressed down," rather than "how much fusion has occurred at the interface."
Even more problematic is that the proportions of these components are not fixed. When temperature, pressure, or material viscosity changes, the proportion of effective melt depth within the same 0.39 mm range can vary significantly: at 180 °C, it primarily yields in the high-elastic regime; at 230 °C, it predominantly undergoes melt flow; and at 280 °C, it is compressed by an excessively rapid collapse rate.
There is another more direct comparative perspective: examining the morphological changes in the upper layer in conjunction with the collapse metric. For these four experimental groups, the collapse values were identical (all 0.39 mm, with the same stopping criterion), and the position of the lower-layer weld seam in the cross-section remained fixed—the welding interfaces of all four groups were located at the same depth (approximately 0.7–0.8 mm), without shifting in response to parameter variations. The only characteristics that actually varied with the parameters were those of the upper layer: the brightness of the weld layer (WeldBR: 0.562–0.978), the transverse uniformity of the light-transmitting layer (latCV: 0.43–0.61), and the intensity of the bright band at the interface (1.22–2.27).
Consider these three observations combined: the indentation depth reading is identical, the position of the bottom weld seam remains unchanged, yet the morphology of the top layer differs markedly—this indicates that the indentation depth reading neither corresponds to the state of the bottom interface nor synchronously reflects changes in the top layer's morphology. It merely quantifies "how much the part has been depressed," rather than capturing "what the interface looks like after such depression."
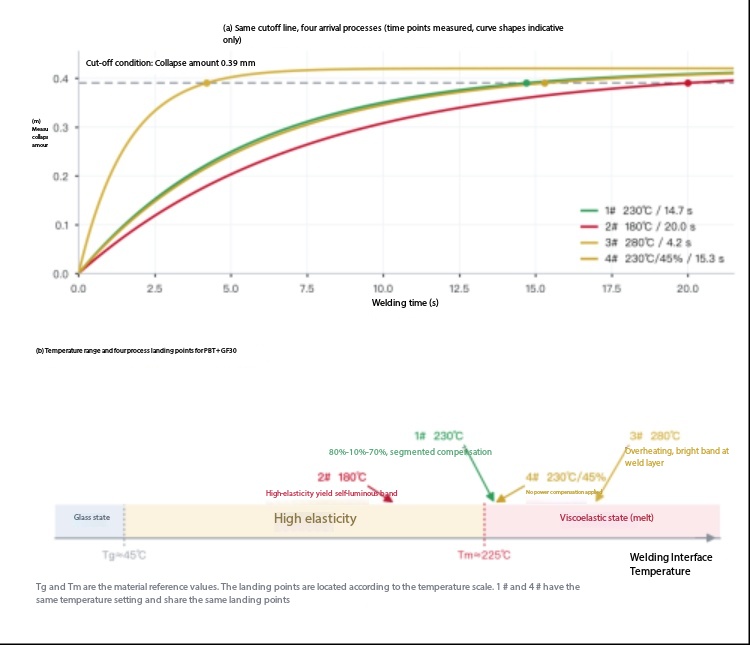
Figure 8: (a) Four arrival processes below the same cutoff line; (b) Temperature range of PBT+GF30 and the four process endpoint sets.
Regarding the material itself: PBT+GF30 enters the highly elastic state when the temperature exceeds Tg ≈ 45 °C, and transitions into the viscous flow state when the temperature exceeds Tm ≈ 225 °C. Only when the interface reaches the viscous flow state—and maintains sufficient superheat and adequate dwell time—do the polymer chains have the opportunity to diffuse and entangle, thereby forming effective welds upon cooling. At 180 °C, the material resides within the highly elastic state; deformation occurs via yield, resulting in pseudo-collapsing. At 230 °C, the temperature just surpasses the melting point, providing the fundamental conditions for melting; however, whether sufficient superheat and dwell time are present still require verification via cross-sectional examination. At 280 °C, the temperature far exceeds the melting point, leading to a sharp decrease in viscosity, premature collapse, and an associated risk of thermal damage.
The collapse measurement indicates whether the equipment is stable, whereas the cross-sectional inspection indicates whether it has been welded.
VII. Expanding the perspective to a mass-production batch: blind spots in collapse rate control
The first four parameter sets constitute a deliberately designed control experiment. In a mass-production environment, what would the characteristics of a batch defined by "collapse rate as the core control metric" look like? We happen to have such a batch of samples: the customer's quality control criterion consists of a single metric—collapse amount (collapse rate); on the equipment side, the process is governed by a collapse amount threshold, without a temperature closed-loop feedback mechanism; on the quality side, release is based solely on the collapse amount. We conducted full OCT inspections on all samples in this batch, recording the local collapse amount at 256 inspection points along the circumferential direction of each weld seam.
First, examine the extent of collapse itself (Figure 10). When the collapse curves of 29 specimens are plotted on the same graph, the overall patterns exhibit high consistency—the characteristic "three valleys and two peaks" circumferential profile is consistently reproduced in each specimen: a relatively high starting segment, a distinct trough in the middle section, followed by a rebound in the latter segment before another decline. This "three valleys and two peaks" morphology is widely observed across all specimens, indicating a strong correlation with circumferential positioning—reflecting the circumferential distribution of clamping/pressing conditions or energy, rather than random noise. The batch testing results obtained via OCT technology undoubtedly provide valuable guidance for the production process.
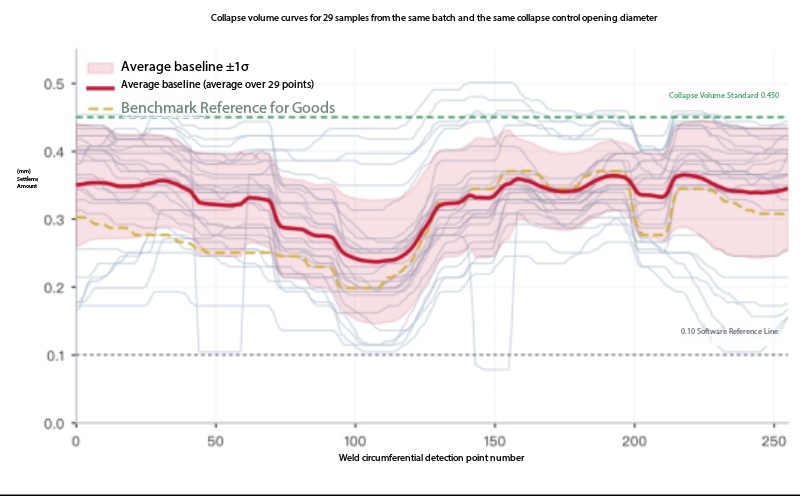
Figure 9: Collapse amount curves and average baseline for 30 sample pieces from the same production batch (the gold line represents the qualified product benchmark; the green line represents the 0.450 mm collapse amount standard)
However, when comparing the collapse measurement readings with the effective weld fusion rate (EWR)—defined as the proportion of the green effective weld fusion zone in the Result判定 diagram—at the same location, issues arise. The overall average collapse measurement for this batch of samples ranged from 0.191 mm to 0.440 mm; when analyzed by weld position, only four specimens met the 60% effective weld fusion rate criterion.
More critically, is the relationship between the two (Figure 10):
· When viewed circumferentially, the degree of collapse is inversely related to EWR—the higher the collapse position, the lower the effective weld fusion rate (r=−0.54). In the initial segment and the high-collapse zone, EWR ranges only from 25% to 30%, whereas in the low-collapse zone, it reaches 49%. However, after accounting for the common factor of "circumferential position," the relationship between collapse degree and EWR nearly disappears: the response curve becomes nearly horizontal (r=+0.05), with a slope of merely 19 percentage points per mm—meaning that increasing the collapse degree by an additional 0.10 mm would yield only approximately 2 percentage points in the effective weld fusion rate.
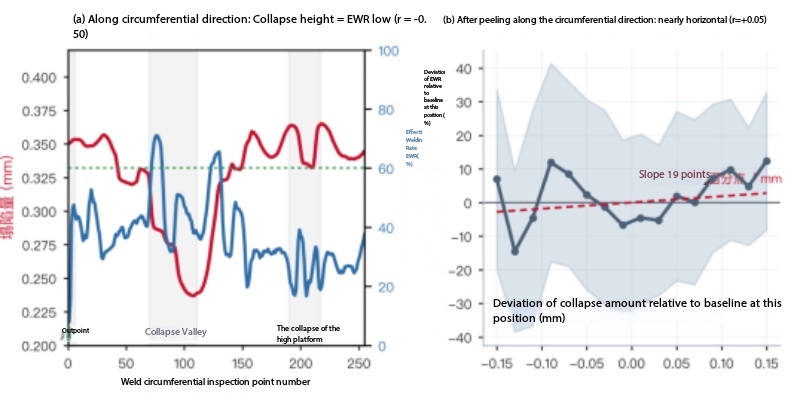
Figure 10: (a) The collapse magnitude baseline and the EWR baseline exhibit counter-phase behavior along the circumferential direction; (b) After removing the circumferential position dependence, the collapse magnitude contributes negligibly independently to EWR.
These two curves collectively illustrate one point: the collapse rate control ensures "equipment stability" —that is, for the same batch and under identical parameters, the collapse magnitude curve consistently and reliably replicates itself across every individual sample; however, it cannot guarantee "whether the weld has been successfully completed" —the fact that collapse magnitude readings fall within the acceptable window does not equate to achieving a satisfactory weld pass rate; these are two largely independent phenomena.
The collapse rate ensures procedural consistency, but cannot guarantee the validity of the outcomes—this constitutes another facet of "false collapse."
At this stage, "false collapse" has two distinct manifestations: when the reading is adequate but the interface has not actually fused, this is termed a "sub-thermal" false collapse; when the reading is insufficient despite the interface having indeed fused, this constitutes an overly conservative judgment. In this production batch, the sample set exhibiting the lowest degree of collapse unexpectedly achieved the highest effective weld fusion rate for the interface zone—the extent of collapse alone cannot confirm whether welding has occurred, nor can it rule it out.
VIII. Why displacement-based closed-loop control fails to regulate the welding interface
In displacement closed-loop control, the feedback variable is position, and the controlled object is also position. This approach ensures that each product is pressed to the same depth; however, it cannot guarantee that each product, upon reaching this depth, will exhibit the same molten state at its interface.
Therefore, it will fail in both directions:
· Underheating direction (2# 180 °C): The component has reached its target position, but the interface has not entered the viscous flow state, leaving an unmerged bright white band in the cross-section;
· Overheating direction (280 °C): The displacement is achieved prematurely, resulting in excessive heat input, which leaves a bright weld bead and uneven transition zone on the cross-section.
Even more problematic is that these two failure modes—which are completely opposite in nature—can coexist under the same collapse metric reading, yet both be judged as "passing."
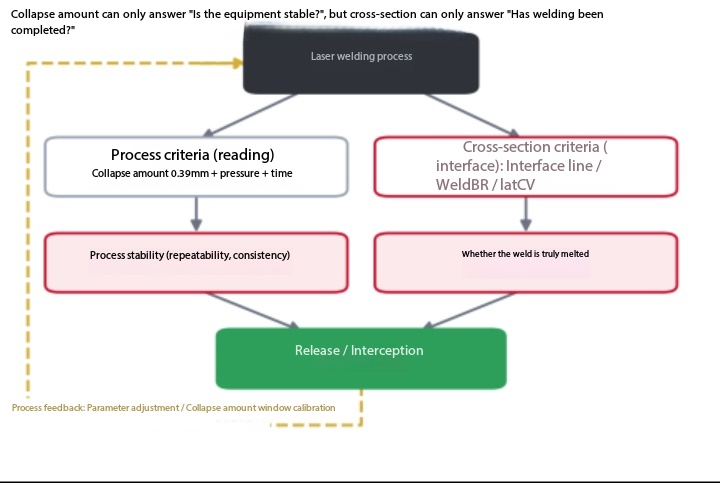
Figure 11: Transition from a single-process criterion to a closed-loop system employing a dual "process + cross-section" criterion
The continuous improvement of equipment precision—electro-hydraulic cylinders, μm-level displacement sensors, and monolithic glass press-fitting—addresss the issue of "reading accuracy"; however, when a reading is deemed "passing," whether the interface has indeed been fused must be verified via cross-sectional inspection.
IX. Engineering Recommendations
Based on the experimental results from these four sample sets and the batch analysis of 30 production units, we recommend adjusting the quality control logic in the following areas.
1. Define the scope of the collapse measurement. The collapse measurement should serve as a "process stability criterion" (repeatability, consistency, equipment status trends), rather than a "quality release criterion." It can indicate whether the equipment is stable, but it cannot determine whether the welds have been properly welded.
2. Introduce additional section inspection criteria and prioritize the rectification of severe defects. It is recommended to designate "the presence of continuous high-reflectivity interface lines at the weld seam" as a zero-tolerance criterion—this serves as direct evidence of lack of fusion.
3. Upgrade the collapse threshold logic: replace the single-displacement threshold with a dual-condition threshold based on "displacement + time/energy." When the time required to reach the collapse threshold significantly deviates from the process window (e.g., the difference of 4.2s vs. 20.0s in this experiment), an alarm should be triggered rather than allowing the process to proceed. The 280 °C batch in this experiment serves as a typical example: a duration as short as 4.2s itself constitutes a signal that should trigger an early warning.
4. Convergence temperature window. Ensure that the interfacial temperature enters the viscous flow regime while maintaining an appropriate superheat level, and simultaneously avoid the overheating region. For PBT+GF30, temperatures that are too low may lead to false collapse within the high-elasticity regime, whereas temperatures that are too high can cause collapse overshoot and thermal damage; therefore, this window must be calibrated individually for each product.
5. Incorporate power compensation into the process variables. A comparison between No.1 and No.4 reveals that when temperature, duration, and total output power are similar, the performance of segmented power compensation and constant output can still be distinguished (relative brightness of the welding layer: 0.834 vs. 0.898). The distribution of power along the scan line represents a process degree of freedom that cannot be fully captured by the collapse metric readings.
6. Establish product-specific "settlement amount–cross-sectional profile" correlation curves. Using DOE, calibrate the settlement range and temperature range for each product, align the cross-sectional classification results with process parameters, and thereby establish a quality standard of "one product, one formulation."
7. If the collapse rate is used as the primary control metric for the production line, heightened caution is warranted: among the 30 sample pieces of this mass-production batch, all collapse measurements fell within the 0.450 mm window, yet only 4 pieces achieved an effective weld integrity rate of 60%. It is recommended to concurrently incorporate additional quality criteria—such as cross-sectional inspection and effective weld integrity rate—alongside the collapse measurement; both criteria are indispensable.
———
epilogue
Collapse measurement is a useful tool, but it measures a "process" rather than a "result." Continuous improvements in equipment precision address the issue of "whether the readings are accurate"; however, when the readings are "passing," whether the weld has actually been completed must be determined by quantitative evidence of the internal bonding condition of the weld.
The bright white band observed on the cross-section at 180 °C serves as the most direct evidence of "false collapse": the collapse metric reading meets all specified criteria, yet the interface has never achieved fusion. None of these four parameters—temperature, power compensation, collapse threshold logic—have yet reached a state suitable for final qualification; each variable has left its own trace on the cross-section. Only by repositioning the collapse metric to its appropriate role—acting as a process criterion—and subsequently applying the quality criterion to the cross-section can the quality release of plastic laser welding truly achieve a closed-loop process.
Wekeri Optoelectronics | Industrial Laser Application System Service Provider
 Home
 Products
 Telephone
 Message


