


Over the past period, in collaboration with our clients, we have conducted thousands of validation cases regarding the application of OCT in defect detection for plastic laser welding. Combined with the inspection results of millions of products delivered to our end customers, one conclusion has become increasingly clear—
The value of OCT as a "testing device" lies in its high sensitivity to process parameters.
In other words: treating OCT merely as a sieve—utilizing only 30% of its potential—would be an underutilization; instead, treating it as a probe that penetrates the inner workings of the process is the most appropriate approach.
The aim of this article is to decompose the value of detection technologies into several dimensions, elucidating each dimension in turn, and to demonstrate why the magnitude of this value increases as we progress to higher-level dimensions.
I. Four Value Dimensions: Each level is progressively closer to money than the one above it
If we were to rank the value of OCT detection technology, it would roughly follow this hierarchy:
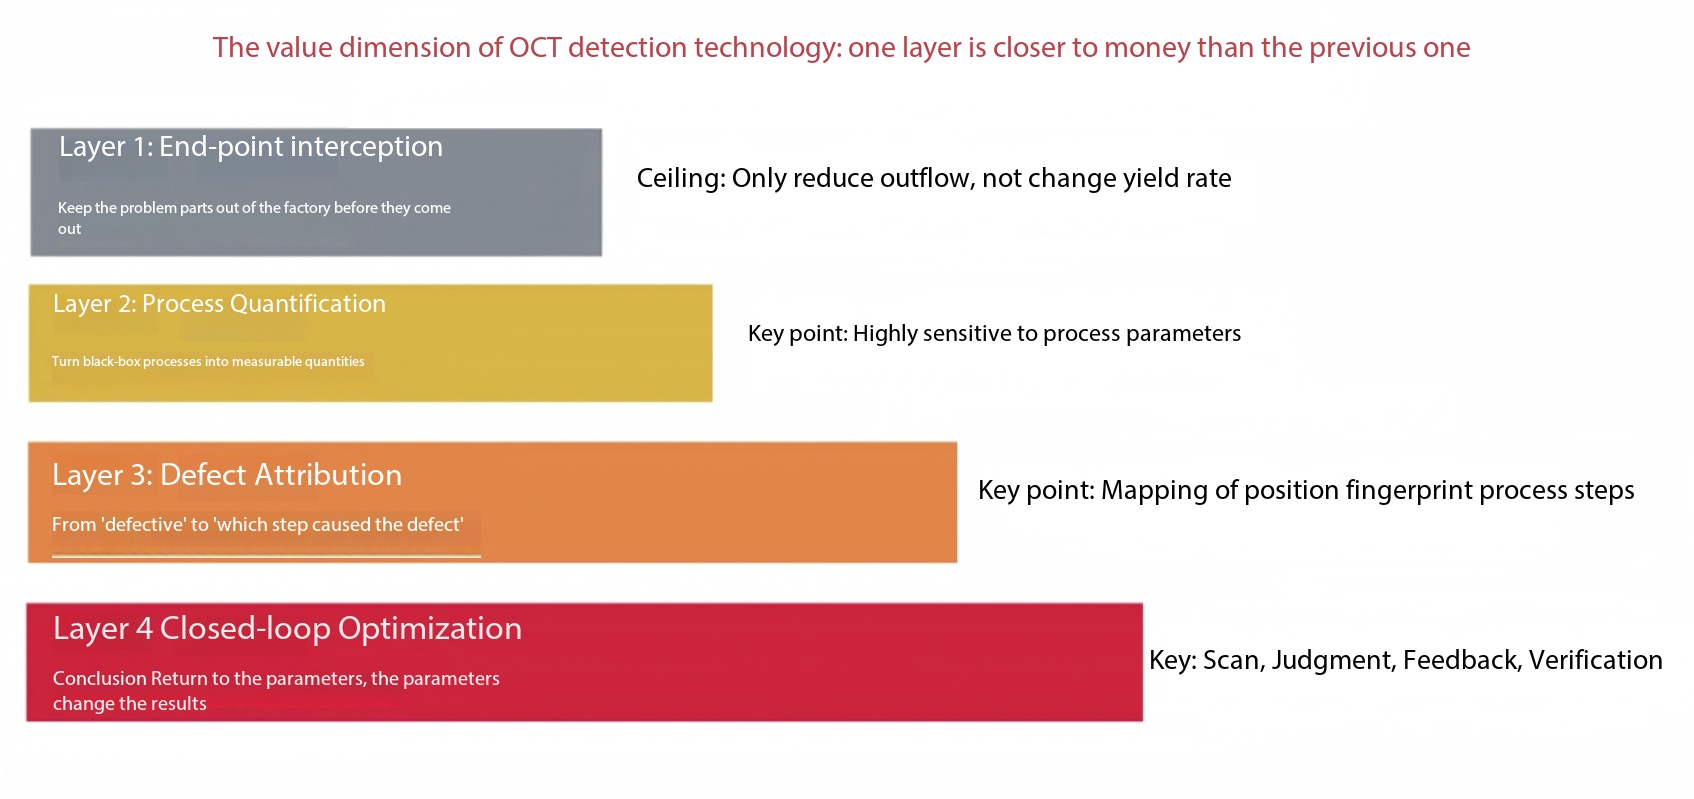
Figure 1: The four value dimensions of OCT detection technology. Each successive layer serves as the foundation for the one below it, yet the magnitude of their value differs by an order of magnitude.
The first layer is endpoint interception: preventing defective items from leaving the factory. This represents the most intuitive and readily observable value.
The second layer is process quantification: because OCT is highly sensitive to process parameters, it can transform previously invisible processes into a set of quantifiable, comparable, and traceable numerical values.
The third layer is defect attribution: the numbers here refer not merely to "good or bad," but to "which specific step caused it."
The fourth stage is closed-loop optimization: the conclusions are then applied back to the process parameters—resulting in the optimization of welding and related process parameters—after which the results are used to validate the original conclusions.
The preceding layer serves as the foundation for the subsequent layer—without end-point interception sensitivity, quantification is impossible; without quantification, attribution is impossible; without attribution, the closed loop cannot be activated. However, in terms of value magnitude, they do not belong to the same tier.
II. First Layer: The Value of End-point Interception and Its Ceiling
The predominant method in plastic laser welding is transmission welding: the upper layer is transparent, while the lower layer is opaque; the energy is converted into heat at the joint interface, causing the interface to melt, the molecular chains to diffuse across each other, and then to re-entangle upon cooling. The ultimate strength of the joint is determined by this internal process within the material. The lower layer typically consists of black material, and after welding, the weld seam is completely encased, making it invisible to the naked eye from the exterior.
Traditional testing methods—airtightness testing, water immersion testing, tensile testing, burst testing, and destructive sectioning—all have their value; however, they only address whether "leakage is currently present" and "whether the tensile strength is sufficient," rather than revealing "what internal structure the weld seam actually possesses." A product with localized incomplete welds could still pass airtightness testing—provided that the weak areas have not yet formed a continuous passage.
No leakage does not guarantee that the weld joint is reliable.
The distinguishing feature of OCT is its ability to detect abrupt changes in refractive index: when fusion is achieved, the interface disappears and the signal becomes homogeneous; when fusion fails, the interface persists, resulting in a distinct reflective bright band. Its axial resolution is 20 μm—one order of magnitude higher than that of ultrasound—while it operates non-contactly and requires no coupling medium. At a maximum speed of 100 slices per second, each scan can be completed within 10–20 seconds; this speed has transformed full-scale inspection from a "theoretically feasible" capability to one that is "practically viable" in production scheduling.
Thus, it fulfills its first function: to intercept defective items at the end of the production line, preventing them from flowing onward.
However, this value has its ceiling.
What can be done once a defect is detected? The defective item can be scrapped or reworked. This approach raises the quality floor for products leaving the factory, but it does not alter the yield rate of the production process—the next unit will still have the same probability of exhibiting defects.
No matter how stringent the inspection is, it only makes it possible to identify defective parts more accurately. The rate at which defective parts emerge, however, remains unchanged.
From a financial perspective, this is a typical cost center: it incurs identification costs to mitigate external failure losses; it does not generate revenue.
III. Second Layer: Why OCT Can, in Turn, Guide the Manufacturing Process
What truly sets OCT apart is another characteristic of its technology: the quantitative results are highly sensitive to process parameters.
The experimental findings indicate that variations in welding temperature, pressure, laser output power, as well as ambient room temperature, temperature of the material itself, and even changes in moisture content, can all result in differing values at the weld interface. Moreover, these variations exhibit a distinct directional pattern rather than being random. This phenomenon has been consistently observed across multiple experimental runs.
Evidence 1: Actual collapse extent of the welding equipment
It does not participate in the welding process, nor does it read displacements within the equipment coordinate system. Instead, it measures the actual internal collapse morphology of the material after welding—representing a state metric relative to the material's reference condition.
To put it differently: the device provides "the amount I believe I applied pressure," whereas OCT provides "the actual state of the weld." The difference between these two values lies in the elastic recovery that varies with temperature; it is precisely this discrepancy that makes "accurate reading" and "interface fusion" two distinct aspects that require separate verification.
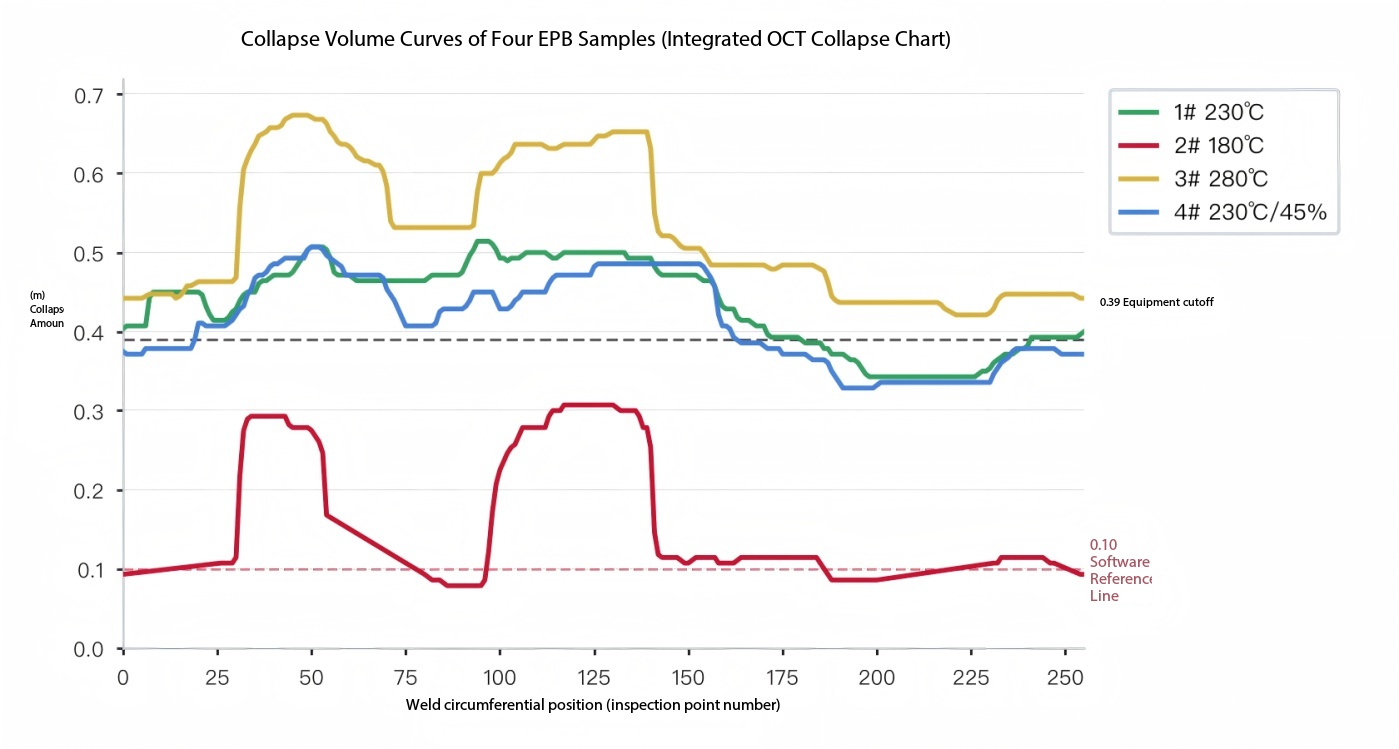
Actual collapse measurement under OCT inspection (all welding process results show 0.4 mm)
Evidence 2: Process quantities and state quantities can be completely decoupled.
In a previous experiment, a production batch consisting of 50 sample pieces was subjected to welding under four different parameter sets. After passing the initial airtightness screening, all specimens underwent high-and low-temperature impact tests as well as durability testing. Under repeated pressure testing at 0.3 MPa, the shortest time to detect leakage was 6 hours, while the longest duration without leakage was 70 hours. Furthermore, in subsequent data analysis, the types of defects exhibited strong correlations with the OCT inspection results.
This contrast highlights a critical point: the location of defects can not only be detected using OCT, but also be addressed through further optimization of the manufacturing process.
Evidence 3: The fingerprint of the defect location can directly pinpoint the specific manufacturing stage.
OCT performs point-by-point scanning along the weld seam; each scan slice is assigned its own number, coordinates, and cross-sectional image. Consequently, the locations where defects are concentrated generally correspond to specific stages in the manufacturing process:
Concentrated defects at corners and closed points are highly likely to result from thermal accumulation at scan overlap areas; uniformly low defects along the circumferential direction should prompt a review of whether the overall thermal budget is adequate; scattered point defects are more likely attributable to interface contamination, assembly gaps, or uneven pressure distribution.
Please note the distinction: this is not "a defect has been discovered," but rather "a process parameter has been identified." The former provides information limited to this single item, whereas the latter can be reused across all products made from the same material and featuring the same structure.
IV. Why the second layer of value far outweighs the first layer?
This matter can be understood from three perspectives. First, let us compare the differences between the two layers in a table:
Comparison Dimensions | Layer 1: End-point interception | From the second layer onward: Process Quantification and Optimization |
Target Object | Products already produced | Process parameters of the product generation |
Questions answered | Is this item compliant? | Why did this happen? |
Nature of Income | Avoid external failure losses (cost item) | Increase yield and cycle time (revenue item) |
time scale | Single-use, one-off | Continuous and linearly scalable with production volume |
Reusability | This is the end of the information. | Can be reused in products made of the same material and with the same structure. |
Value ceiling | ≈ Cost of intercepted items | ≈ Yield potential across the entire production line |
Table 1: Comparison of Target Objects, Nature of Benefits, and Ceiling Effects of the Two Layers of Value
Let us now address each point in detail.
First, one is screening, and the other is transformation.
Inspection involves making a cut through the existing quality distribution and removing the portion that falls below the specification limits. The shape and position of the distribution remain unchanged, and the rate at which defective parts are produced also remains the same.
Process optimization involves shaping this distribution—shifting the mean toward the center of the specification limits while narrowing the standard deviation. When these two actions are combined, the probability of observations falling in the tails beyond the specification limits decreases exponentially, rather than linearly. Defects, however, tend to occur in these tails, which are the most sensitive regions to changes in the distribution's parameters.
One involves post-event sorting, while the other occurs before the event.
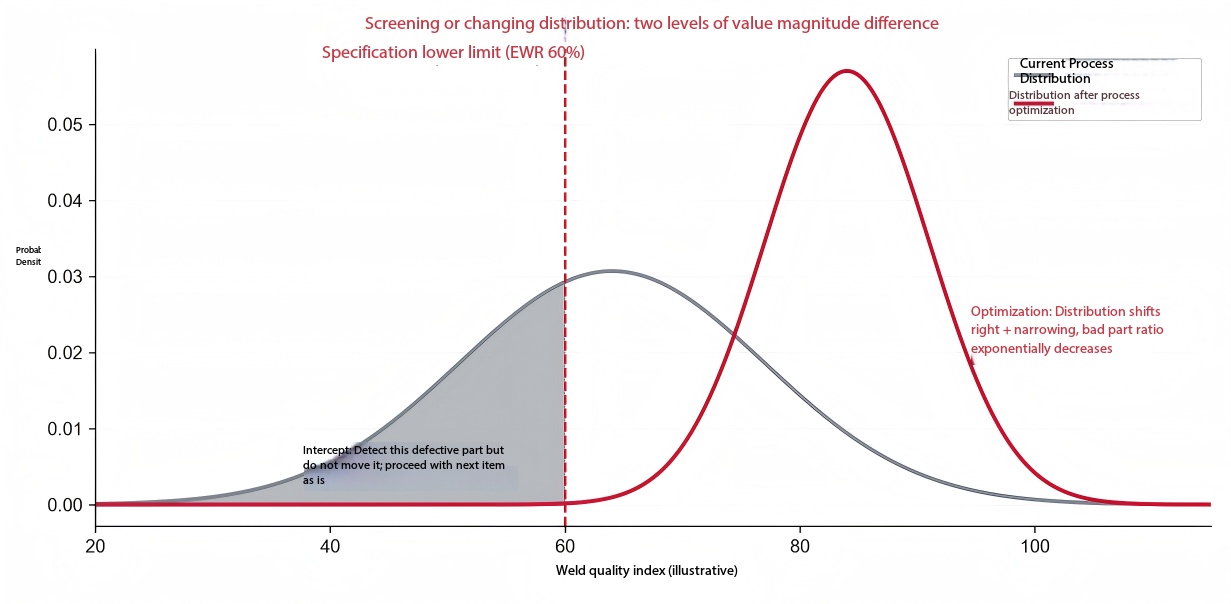
Figure 3: Screening versus Distribution Shift—The Order-of-Magnitude Difference Between Two Values (Principles Schematic).
Second, there are two items: one representing costs and the other representing revenues.
The investment in inspection equipment is classified as appraisal cost within the quality cost (COQ) framework. Its purpose is to reduce losses from external failures; however, it does not generate revenue itself—and as the detection rate increases, the costs associated with scrap and rework will also rise accordingly.
Process optimization directly impacts yield and production cycle time. An increase in yield by one percentage point provides sustained marginal gains in large-scale production; cost reduction, however, is not a one-time expense but rather an ongoing daily effort.
Equipment investment is a one-time expense, while yield-based returns are ongoing.
Third, address "this specific case," while addressing "this category of cases."
The test result is "Item 1,234: NG." That is all there is to know.
The process optimization yielded the following conclusion: "Within a temperature window of 230 °C, thermal accumulation in the overlap region resulted in insufficient melting at the closure point; after adjusting the scan overlap ratio from X to Y, the EWR increased from 62% to 78%." This conclusion can be applied to every product variant using the same material and structure.
The reusability of information determines its value magnitude.
V. What lies between "Detection" and "Optimization"?
It should be clearly understood that the sensitivity of OCT is an inherent capability; however, translating this sensitivity into process guidance capabilities requires engineering expertise.
From a suite of OCT imaging capabilities to a device capable of guiding manufacturing processes, there are four distinct stages in between:
The first factor is the scanning strategy—specifically, where to scan, in what order to scan, and at what interval to sample points; this strategy determines the coverage rate and the missed-detection rate.
The second criterion is the defect criterion—what signal characteristics on the flaw detection map indicate lack of fusion, which determines the physical validity of the assessment.
The third factor is the product standard—the scope of its applicability—which determines whether the standard is relevant to the product's functionality.
The fourth aspect is the quality closed-loop—how the conclusions are mapped back to the process parameters—which determines the upper limit of this equipment's value.
The first three decisions determine "how accurate they are," while the fourth decision determines "whether they are worth it."
Once the closed-loop mechanism is activated, what specific changes will occur?
Once the closed-loop process is operational, the adjustment of process parameters shifts from "trial and error based on experience" to "data-driven optimization." In the context of plastic laser welding, at least several aspects will be directly revised:
First is the narrowing of the temperature window. Since the collapse rate serves as a proxy for the weld seam temperature, there is no longer a need to rely on speculation to define this window—specifically, which temperature range will ensure that the EWR remains consistently within acceptable limits can be determined experimentally and plotted as a curve.
The second point is a re-evaluation of pressure engineering. Pressure determines the interfacial contact state and thermal resistance: insufficient pressure can create gaps, leading to internal reflective scattering, reduced thermal budget, incomplete fusion, and porosity; conversely, excessive pressure can cause material overflow and flash formation, thinning of the weld bead, and displacement of the glass fibers toward the overflow front. Moreover, the "effective pressure" throughout the welding process is not constant—during the initial phase, the pre-pressure has not yet been established, and in the closing phase, the constraint on the molten material is weak; these two stages precisely coincide with the phenomena of insufficient heating during cold start and thermal accumulation at the closing point.
The third step is to analyze the scan overlap rate and the thermal budget at closure points. Defects tend to concentrate at corners and closure points; the underlying issue is often not "insufficient energy," but rather "excess energy at the overlap regions." This distinction can only be established once it has been quantified.
Fourth is the batch-to-batch consistency of the material's optical constant. When the same process parameters are used but a different batch of material is employed and its transmittance varies, the weld seam characteristics will also change—a phenomenon that cannot be detected from process parameters, but instead manifests solely in the weld seam structure.
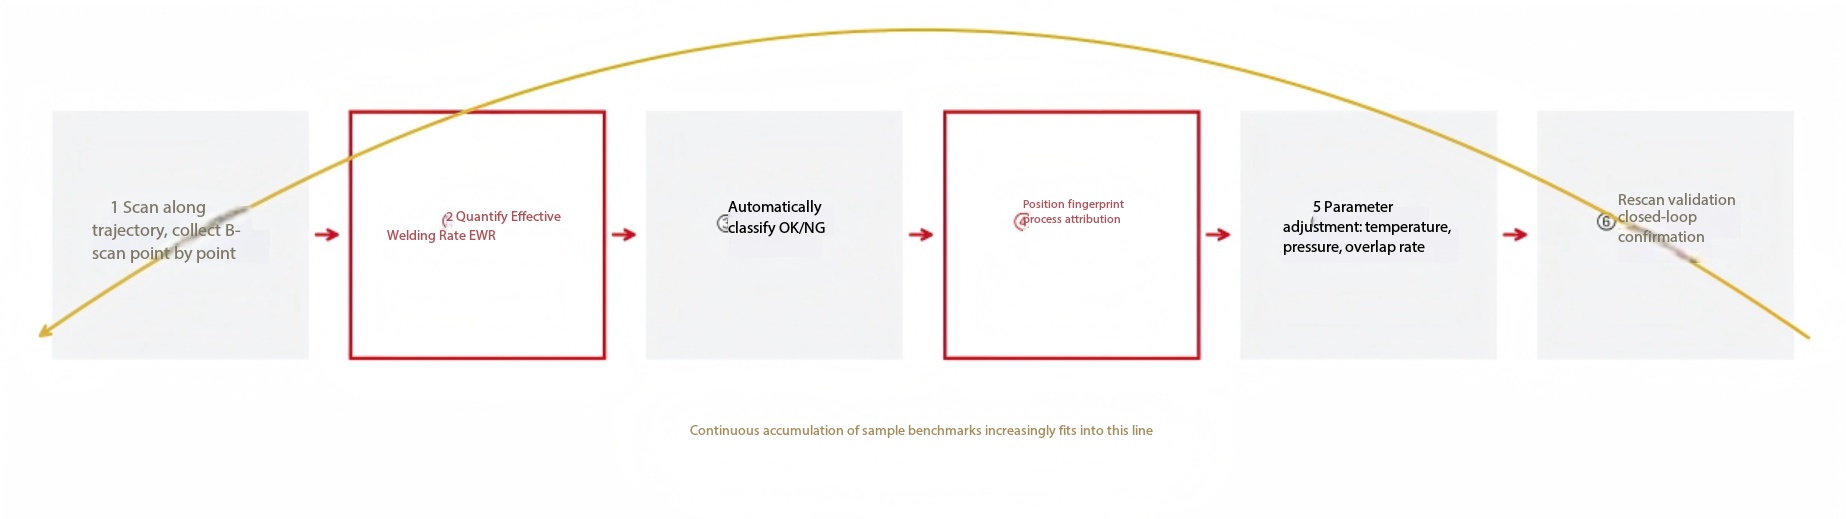
Figure 4: The closed-loop from scanning to parameter feedback. Once this closed loop is operational, "detection" transforms into "process optimization."
A reality that has not yet reached a closed loop
When we claim that the second layer of value is more significant, it does not mean that it has already been realized. On the contrary—based on recent validation, in most cases within the industry, this layer of value remains merely theoretical.
A typical example of a mass production batch involves 40 sample pieces submitted by the customer; the in-process production parameters and collapse measurements consistently fell within the control limits, and the leak tightness also fully complied with specifications—none of the samples exceeded the limits. However, when evaluated against the effective weld integrity rate criterion, only 60% of the samples met the requirement. Moreover, upon aggregating the data, a clear pattern emerged regarding the defects. The customer adopted the collapse rate as the sole core control metric, yet no clear correlation was established between the collapse magnitude and the weld integrity status.
In other words, the process parameters are measured very precisely, yet no one knows what they signify. This is precisely what characterizes the absence of a closed loop—not a lack of data, but rather the fact that the data does not feed back into the process.
VI. Conclusion
By now, plastic laser welding has reached a level of sophistication—electrodynamic cylinders, displacement sensors, temperature constant feedback, and power compensation; every controllable parameter has been implemented.
However, one critical gap has persisted: while we meticulously control a multitude of process parameters, few of us have ever actually inspected the internal structure of the weld seam—or, ultimately, the resulting weld quality. Clearly, traditional inspection methods can no longer keep pace with contemporary manufacturing processes. Between the process parameters and weld quality lies an unverified assumption.
The significance of OCT lies in transforming this hypothesis into a verifiable measurement.
Addressing a single defective item incurs a cost per item; identifying the root cause of the defect, however, yields the overall yield rate of the entire production line.
Interception is merely the baseline.
The technical value of OCT in non-destructive testing: half lies at the end, and half at the process stage.
Wekeri Optoelectronics | Industrial Laser Application System Service Provider
 Home
 Products
 Telephone
 Message


